Asked by Jessica Gonzalez on Jun 07, 2024

Verified
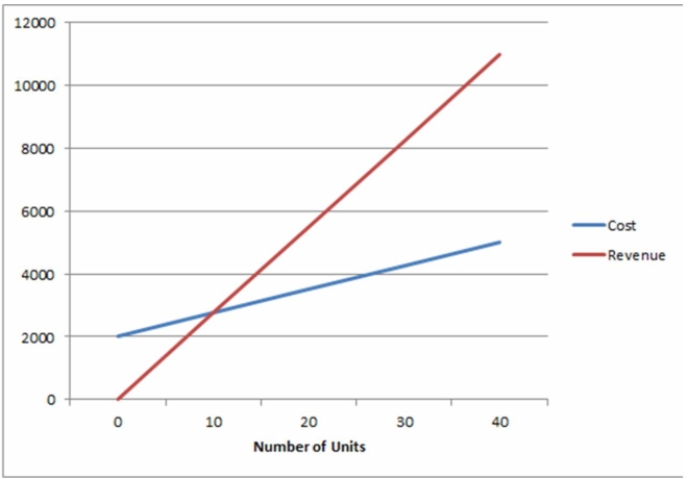
Use the graphical approach to CVP analysis to solve the following problem.
Jordan is developing a business plan for a residential building inspection service he wants to start up. Rent and utilities for an office would cost $1,000 per month. The fixed costs for a vehicle would be $450 per month. He estimates that the variable office costs (word processing and supplies) will be $50 per inspection and variable vehicle costs will be $25 per inspection. Jordan would also spend $200 per month to lease a computer, and $350 per month for advertising.
a) If he charges $275 per inspection, how many inspections per month are required before he can "pay himself?"
b) How many inspections per month are required for Jordan to be able to draw a salary of $4,000 per month?
Variable Costs
Variable Costs are expenses that change in proportion to the activity of a business.
Fixed Costs
Costs that do not change with the volume of production or sales, such as rent, salaries, and insurance premiums.
Business Plan
A formal document detailing the goals, strategy, market, and financial projections for a business's operations.
- Assess the points of break-even in both numeric and fiscal terms via diversified strategies, and understand their implications.
- Engage with the graphical approach in cost-volume-profit analysis to showcase how profits or losses fluctuate across various levels of sales volume.

Verified Answer
JR

Learning Objectives
- Assess the points of break-even in both numeric and fiscal terms via diversified strategies, and understand their implications.
- Engage with the graphical approach in cost-volume-profit analysis to showcase how profits or losses fluctuate across various levels of sales volume.