Asked by Jonathan Catano on Apr 25, 2024
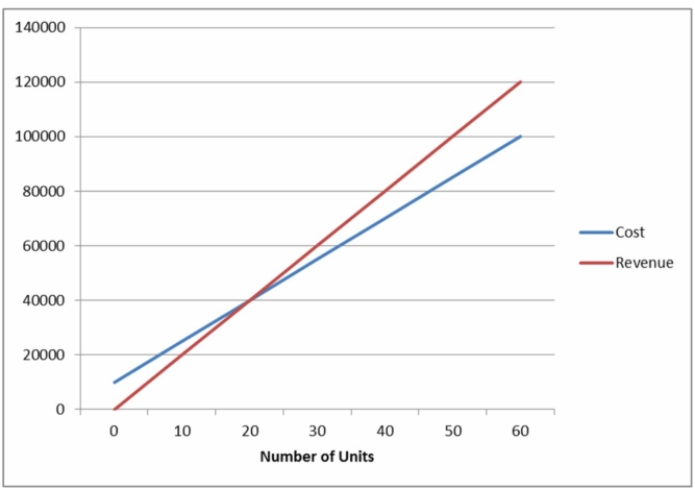
Use the graphical approach to CVP analysis to solve the following problem.
Home Security Systems Inc. assembles and packages home security systems from brand-name components. Its basic home security system is sold to customers who prefer to install the system themselves in their own home. Each system is assembled from components costing $1400 per system and sells for $2,000. Labour costs for assembly are $100 per system. This product line's share of overhead costs is $10,000 per month.
a) How many basic security systems must be sold each month to break even on this product line?
b) What will be the profit or loss for a month in which 15 basic home security systems are sold?
Labour Costs
The total expenditures for hiring employees, including wages, benefits, taxes, and any other costs associated with employing labor.
Overhead Costs
Indirect expenses related to the operation of a business, such as rent, utilities, and administrative costs.
- Calculate break-even points in units and dollars using different methods and interpret the results.
- Apply the graphical approach to CVP analysis for visualizing profit or loss at various levels of sales volume.

Learning Objectives
- Calculate break-even points in units and dollars using different methods and interpret the results.
- Apply the graphical approach to CVP analysis for visualizing profit or loss at various levels of sales volume.