Asked by Yamaris Estrella on Apr 24, 2024
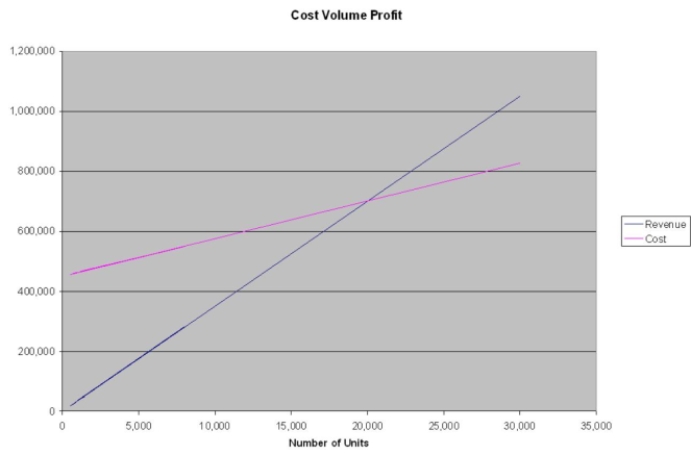
Sam manufactures a product that is selling so well, he has decided to expand his operation to 50,000 units per month. The unit cost is $7, estimated fixed costs are $1.8 mil per year and variable costs are $5 per unit. The product currently sells for $20. Use the graphical approach to CVP analysis to solve the following:
a) What is the break-even point as a percent of capacity?
b) What would the net income be at 75% capacity?
c) What would unit sales have to be to attain a net income of $100,000?
d) If sales dropped to 50% of capacity, what would the resulting net income be?
Variable Costs
Expenditures that adjust according to the quantity of goods or services produced by an enterprise.
Fixed Costs
Regular outgoings that stay the same whether production or sales rates increase or decrease, for instance, rental costs or salary payments.
Net Income
This refers to the total profit of a company after all expenses and taxes have been deducted from total revenue.
- Employ the graphical strategy in cost-volume-profit analysis to illustrate the impact on profits or losses with changing sales volumes.
- Identify the sales level needed to attain a specified operating income or profit margin.

Learning Objectives
- Employ the graphical strategy in cost-volume-profit analysis to illustrate the impact on profits or losses with changing sales volumes.
- Identify the sales level needed to attain a specified operating income or profit margin.
Related questions
A Manufacturing Company Is Studying the Feasibility of Producing a ...
Use the Graphical Approach to CVP Analysis to Solve the ...
A Manufacturing Company Is Studying the Feasibility of Producing a ...
Use the Texas Instruments BAII Plus Break-Even Worksheet to Solve ...
Use the Graphical Approach to CVP Analysis to Solve the ...