Asked by Monica Landrum on Jun 07, 2024

Verified
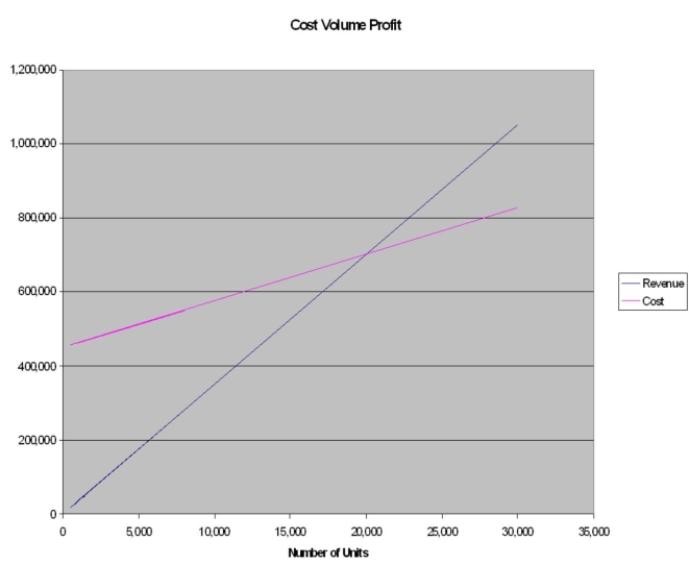
A company expects to sell 30,000 hats at $35 each. The estimated variable cost of each hat is $12.50, and the fixed costs are estimated to be $450,000. Calculate the break-even point in units and revenue. Use the graphical approach to CVP analysis to solve.
Variable Cost
Costs that vary in proportion to the volume of goods or services produced, such as materials and labor.
Fixed Costs
Definition: Business expenses that remain the same regardless of the level of production or sales.
Break-Even Point
The moment when the sum of all expenses matches the sum of all income, resulting in neither a profit nor a loss.
- Evaluate the break-even points expressed in units and dollars utilizing assorted methods, and explicate the conclusions.
- Utilize the graphical method in CVP analysis to visually represent profits or losses across different sales volume levels.

Verified Answer
CG

Learning Objectives
- Evaluate the break-even points expressed in units and dollars utilizing assorted methods, and explicate the conclusions.
- Utilize the graphical method in CVP analysis to visually represent profits or losses across different sales volume levels.