Asked by Jamie Wilson on Jun 27, 2024

Verified
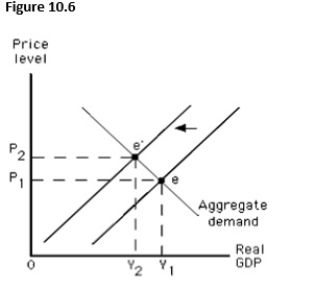
The figure shows the determination of the equilibrium price level and real GDP in an aggregate demand-aggregate supply model.Which of the following economic changes is depicted by a movement from point e to point e'?
A) An increase in short-run aggregate supply
B) An increase in long-run aggregate supply
C) A decrease in short-run aggregate supply
D) A decrease in long-run aggregate supply
E) An increase in the aggregate quantity demanded
Short-Run Aggregate Supply
The aggregate volume of products and services that companies intend to sell within a brief period in the economy, based on existing price levels.
Long-Run Aggregate Supply
Represents the total production of goods and services in an economy at full employment, without any market frictions.
Aggregate Quantity Demanded
The total amount of a good or service that consumers are willing and able to purchase at a given price level in an economy.
- Analyze the impact of aggregate demand and supply shifts on equilibrium in the short run and long run.

Verified Answer
MU
muhammed ulutasJul 02, 2024
Final Answer :
C
Explanation :
Moving from point e to e' represents a decrease in short-run aggregate supply, as evidenced by the decrease in real GDP and an increase in the equilibrium price level.

Learning Objectives
- Analyze the impact of aggregate demand and supply shifts on equilibrium in the short run and long run.