Asked by Jamie Walker on May 13, 2024

Verified
The figure given below depicts long run equilibrium in an aggregate demand-aggregate supply model.The change in real GDP in this figure from Y1 to Y2 could have been caused by:
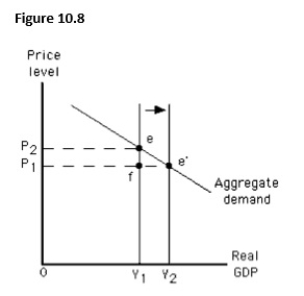
A) a government policy aimed at increasing demand.
B) a change in weather conditions that led to worldwide crop failures.
C) an attempt by key resource producers to monopolize supply.
D) an increase in taxation or a decrease in government spending.
E) an increase in labor productivity.
Real GDP
The measure of a country's economic output adjusted for price changes, providing a more accurate view of an economy's size and how it's growing over time.
Government Policy
Strategies and decisions made by the government to manage its internal and external affairs, including laws, regulations, actions, and funding priorities.
Labor Productivity
A measure of economic performance that calculates the output produced per hour of labor.
- Investigate how fluctuations in total demand and supply influence equilibrium in both the short and long run.
- Ascertain the factors that result in movements along and the relocation of the long-run aggregate supply curve.

Verified Answer

Learning Objectives
- Investigate how fluctuations in total demand and supply influence equilibrium in both the short and long run.
- Ascertain the factors that result in movements along and the relocation of the long-run aggregate supply curve.
Related questions
Which of the Following Is Most Likely to Shift the ...
The Figure Shows the Determination of the Equilibrium Price Level ...
Which of These Is Most Likely to Reduce the Potential ...
Given Implicit or Explicit Resource Price Agreements,if the Actual Price ...
The Figure Below Shows Equilibrium in an Aggregate Demand-Aggregate Supply ...