Asked by Skyler Compo on Jun 09, 2024

Verified
The figure below shows equilibrium in an aggregate demand-aggregate supply model.In this figure,the shift from AS to AS' is likely to occur when:
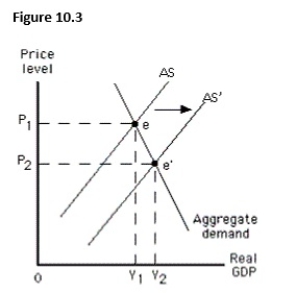
A) the actual price level is higher than expected.
B) the actual price level is lower than expected.
C) the unemployment rate is lower than the natural rate.
D) the actual output is more than the potential output.
E) the aggregate demand curve intersects the short-run aggregate supply curve at the potential output.
Actual Price Level
The current average of all prices of goods and services in an economy, indicating the cost of living and the economic environment.
Potential Output
The maximum amount of goods and services an economy can produce when it is fully employing its resources.
Aggregate Demand
The total demand for all goods and services in an economy at various price levels, over a specific time period.
- Familiarize yourself with the factors that lead to modifications in the aggregate supply curves in the short and long term.

Verified Answer

Learning Objectives
- Familiarize yourself with the factors that lead to modifications in the aggregate supply curves in the short and long term.
Related questions
The Figure Given Below Depicts Long Run Equilibrium in an ...
Which of the Following Is Most Likely to Shift the ...
Which of These Is Most Likely to Reduce the Potential ...
Given Implicit or Explicit Resource Price Agreements,if the Actual Price ...
In the Long Run,the Price Level Is Determined by Aggregate ...