Asked by Jason Fraser on May 26, 2024

Verified
The balance sheet data below for Randolph Company for two recent years. 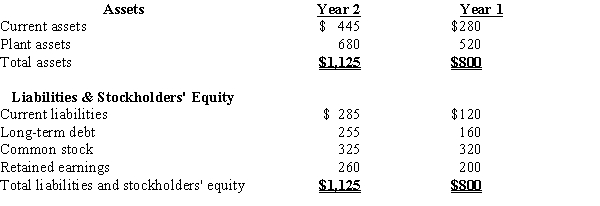 (a)Using horizontal analysis, show the percentage change for each balance sheet item using Year 1 as a base year.
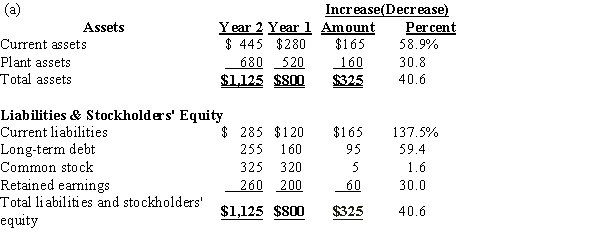
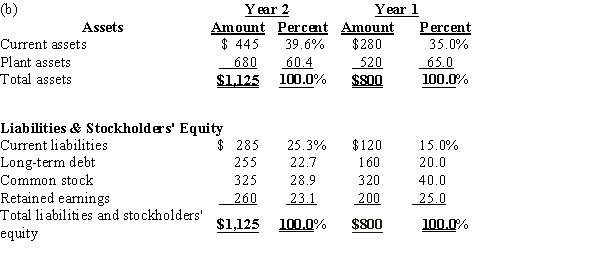
(b)Using vertical analysis, prepare a comparative balance sheet.Round percentages to one decimal place.
Horizontal Analysis
An analytical approach to finance, examining historical financial records from several periods to spot growth trends and patterns.
Vertical Analysis
A technique for examining financial statements by presenting each item in the main categories of accounts (assets, liabilities, and equity) on a balance sheet as a fraction of the overall category.
Balance Sheet Data
Information related to the assets, liabilities, and stockholders' equity of a company as presented in its balance sheet at a specific date.
- Engage in horizontal and vertical examination of financial statements.
- Implement vertical and horizontal analysis for reviewing the financial viability of a company.

Verified Answer

Learning Objectives
- Engage in horizontal and vertical examination of financial statements.
- Implement vertical and horizontal analysis for reviewing the financial viability of a company.
Related questions
Cash and Accounts Receivable for Ashfall Co Based on This ...
Revenue and Expense Data for Young Technologies Inc (A)Prepare an ...
The Following Data Are Taken from the Financial Statements ...
In a Vertical Analysis, the Base for Cost of Goods ...
In a Comparative Balance Sheet, the Accounts Payable Balance for ...