Asked by Taylor Morrison on Jun 29, 2024

Verified
Revenue and expense data for Young Technologies Inc. are as follows: Year 2 Year 1 Sales $500,000$440,000 Cost of goods sold 325,000242,000 Selling expenses 70,00079,200 Administrative expenses 75,00070,400 Income tax expense 10,50016,400\begin{array}{lrr}&\text { Year } 2&\text { Year } 1\\\text { Sales } & \$ 500,000 & \$ 440,000 \\\text { Cost of goods sold } & 325,000 & 242,000 \\\text { Selling expenses } & 70,000 & 79,200 \\\text { Administrative expenses } & 75,000 & 70,400 \\\text { Income tax expense } & 10,500 & 16,400\end{array} Sales Cost of goods sold Selling expenses Administrative expenses Income tax expense Year 2$500,000325,00070,00075,00010,500 Year 1$440,000242,00079,20070,40016,400 (a)Prepare an income statement in comparative form, stating each item for both years as an amount and as a percent of sales. Round to the nearest whole percent.
(b)Comment on the significant changes disclosed by the comparative income statement.
Income Statement
This is a financial statement that reports a company's financial performance over a specific accounting period, detailing revenues, expenses, and net income.
Comparative Form
A grammatical construction used in many languages to compare two items or states, often formed by modifying adjectives or adverbs.
Revenue And Expense
Financial terms identifying the income a company generates and the costs incurred to generate that income, respectively.
- Implement horizontal and vertical analysis on financial statements.
- Apply horizontal and vertical analysis to assess a company's financial health.

Verified Answer
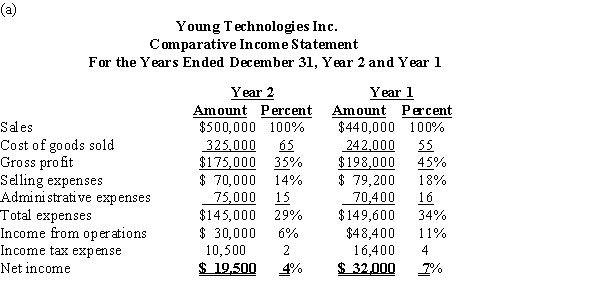 (b)The vertical analysis indicates that the cost of goods sold as a percent of sales increased by 10%
 (65% vs. 55%) between the two years. Selling and administrative expenses as a percentage of sales decreased by 5%, and income tax expense decreased by 2%. Overall, net income as a percent of sales dropped by 3%.

Learning Objectives
- Implement horizontal and vertical analysis on financial statements.
- Apply horizontal and vertical analysis to assess a company's financial health.
Related questions
The Balance Sheet Data Below for Randolph Company for Two ...
Cash and Accounts Receivable for Ashfall Co Based on This ...
The Following Data Are Taken from the Financial Statements ...
In a Vertical Analysis, the Base for Cost of Goods ...
In a Comparative Balance Sheet, the Accounts Payable Balance for ...