Asked by Siddharth Sinha on May 19, 2024

Verified
Sketch the graph of the linear inequality 3x−2y≤−63 x - 2 y \leq - 63x−2y≤−6 .
A) 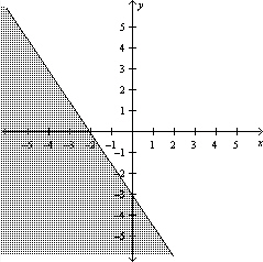
B) 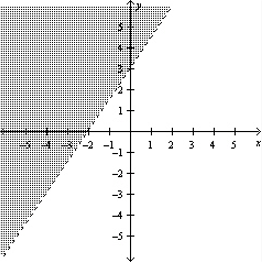
C) 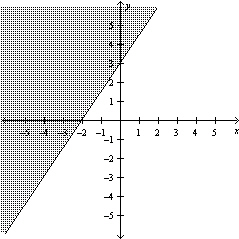
D) 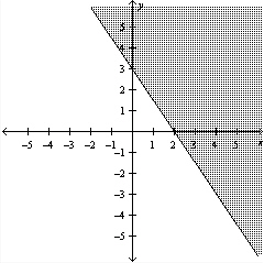
E) 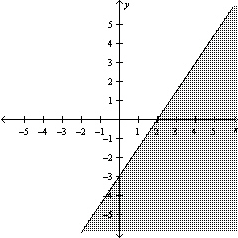
Linear Inequality
An inequality that involves a linear function, represented by a linear equation but with inequalities like <, >, ≤, or ≥ instead of an equals sign.
- Frame and present graphically linear inequalities involving two dimensions.

Verified Answer
YP
Yaneli PerezMay 20, 2024
Final Answer :
C
Explanation :
To graph the linear inequality 3x−2y≤−63 x - 2 y \leq - 63x−2y≤−6 , we first need to graph the line 3x−2y=−63 x - 2 y = -63x−2y=−6 . We do this by finding the xxx and yyy intercepts.
Setting x=0x = 0x=0 , we get 0−2y=−60 - 2y = -60−2y=−6 , so y=3y = 3y=3 . Therefore, the yyy -intercept is (0,3)(0,3)(0,3) .
Setting y=0y = 0y=0 , we get 3x−0=−63x - 0 = -63x−0=−6 , so x=−2x = -2x=−2 . Therefore, the xxx -intercept is (−2,0)(-2,0)(−2,0) .
Plotting these two points and drawing a straight line through them, we get:
Graph:
Now, we need to shade the region below this line to represent the inequality 3x−2y≤−63 x - 2 y \leq - 63x−2y≤−6 . We can test a point inside this region - for example, (0,0)(0,0)(0,0) - to see if it satisfies the inequality.
3(0)−2(0)≤−63 (0) - 2 (0) \leq - 63(0)−2(0)≤−6
0≤−60 \leq - 60≤−6 , which is false.
Since (0,0)(0,0)(0,0) does not satisfy the inequality, we need to shade the region on the other side of the line. This is the region below the line.
Therefore, the correct graph is:
Graph: 11ed7ae8_3727_cdcc_88db_070308ddb142_TBX8968_11
So, the answer is C.

Learning Objectives
- Frame and present graphically linear inequalities involving two dimensions.
Related questions
Determine If the Point (-4,-3) Is a Solution To \(x + ...
Graph the System of Linear Inequalities Below \[\left\{ \begin{array} { l ...
Determine If the Ordered Pair ( 18,0 ) Is a Solution ...
Graph the System of Linear Inequalities Below \[\left\{ \begin{array} { l ...
Graph the Solution to the Inequality on the Real Number \(x ...