Asked by Brandon Mcgee on May 19, 2024

Verified
Graph the system of linear inequalities below. {4x+3y≤8x−y≤2\left\{ \begin{array} { l } 4 x + 3 y \leq 8 \\x - y \leq 2\end{array} \right.{4x+3y≤8x−y≤2
A) 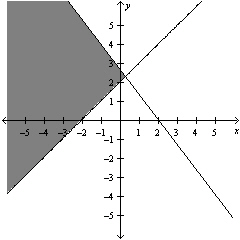
B) 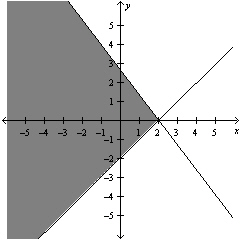
C) 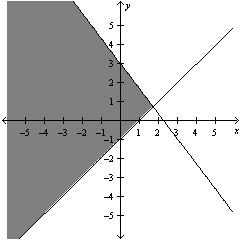
D) 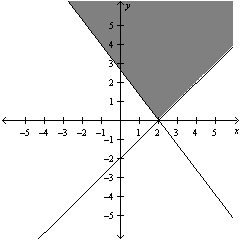
E) 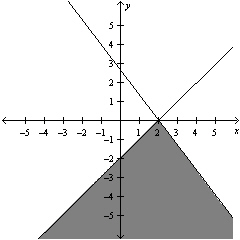
Linear Inequalities
Mathematical statements involving linear expressions that utilize inequality symbols to compare the expressions.
- Sketch graphically systems composed of linear inequalities in two variables.

Verified Answer
JV
Jaden VukelichMay 19, 2024
Final Answer :
B
Explanation :
To graph the system of linear inequalities, we first graph the boundary lines for each inequality.
For $4x + 3y \leq 8$, we can graph the line $4x + 3y = 8$ by finding its $x$- and $y$-intercepts:
When $x=0$, $4(0)+3y=8$, so $y=\frac{8}{3}$, giving us the $y$-intercept $(0,\frac{8}{3})$.
When $y=0$, $4x+3(0)=8$, so $x=2$, giving us the $x$-intercept $(2,0)$.
Plotting these points and drawing the line passing through them, we get:
[asy]
size(6cm);
int xMin = -3;
int xMax = 3;
int yMin = -3;
int yMax = 3;
real f1(real x) {return (8-4*x)/3;}
draw(graph(f1,xMin,xMax),red, Arrows);
dot((0,8/3), red);
dot((2,0), red);
draw((0,yMin)--(0,yMax),black+1.2bp,EndArrow(5));
draw((xMin,0)--(xMax,0),black+1.2bp,EndArrow(5));
label("$x$",(xMax,0),(2,0));
label("$y$",(0,yMax),(0,2));
label("$4x+3y=8$",(xMax, f1(xMax)),(2,0),UnFill);
[/asy]
For $x - y \leq 2$, we can graph the line $x - y = 2$ by finding its $x$- and $y$-intercepts:
When $x=0$, $0-y=2$, so $y=-2$, giving us the $y$-intercept $(0,-2)$.
When $y=0$, $x-0=2$, so $x=2$, giving us the $x$-intercept $(2,0)$.
Plotting these points and drawing the line passing through them, we get:
[asy]
draw((0,-3)--(3,0),blue+1.2bp,EndArrow(5));
dot((0,-2),blue);
dot((2,0),blue);
label("$x-y=2$",(3,0),(2,0),UnFill);
[/asy]
Now, we need to determine which region of the coordinate plane satisfies both inequalities.
We can start by testing the point $(0,0)$, which is not on either boundary line.
For $4x+3y \leq 8$, we have $4(0) + 3(0) = 0 \leq 8$, which is true.
For $x-y \leq 2$, we have $0-0 = 0 \leq 2$, which is also true.
Therefore, the point $(0,0)$ satisfies both inequalities, so the region containing $(0,0)$ is the solution.
Since both lines have negative slopes, the half-planes below each line satisfy the corresponding inequality. The shaded region below the red line and below the blue line is our solution:
[asy]
size(8cm);
int xMin = -3;
int xMax = 3;
int yMin = -3;
int yMax = 3;
real f1(real x) {return (8-4*x)/3;}
real f2(real x) {return x-2;}
filldraw((0,-3)--(3,-1)--(3,0)--(2,0)--(0,2/3)--cycle, gray(0.7));
draw(graph(f1,xMin,xMax),red, Arrows);
draw((0,yMin)--(0,yMax),black+1.2bp,EndArrow(5));
draw((xMin,0)--(xMax,0),black+1.2bp,EndArrow(5));
draw(graph(f2,xMin,xMax),blue+1.2bp, Arrows);
label("$x$",(xMax,0),(2,0));
label("$y$",(0,yMax),(0,2));
label("$4x+3y=8$",(xMax, f1(xMax)),(2,0),UnFill);
label("$x-y=2$",(3, -1),(0,0), UnFill);
[/asy]
Therefore, the answer is $\boxed{\textbf{(B)}}$.

Learning Objectives
- Sketch graphically systems composed of linear inequalities in two variables.