Asked by mursal qaiser on Jun 10, 2024

Verified
Graph the system of linear inequalities below. {x+y<26x+2y>4\left\{ \begin{array} { l } x + y < 2 \\6 x + 2 y > 4\end{array} \right.{x+y<26x+2y>4
A) 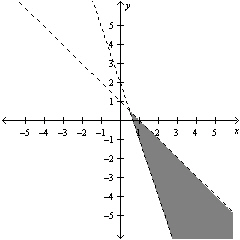
B) 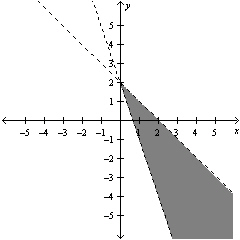
C) 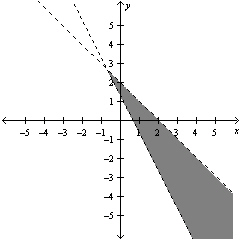
D) 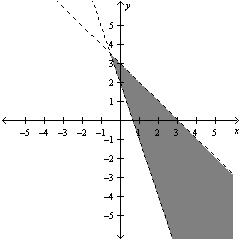
E) 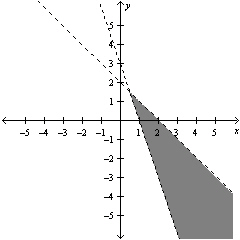
Linear Inequalities
Algebraic expressions that utilize inequality symbols to compare two linear expressions.
Graph
A visual representation of data or mathematical functions typically drawn with an x-axis and a y-axis in a coordinate system.
- Plot systems of linear inequalities with two variables on a graph.

Verified Answer
MK
Mallory KatherineJun 15, 2024
Final Answer :
B
Explanation :
To graph a linear inequality in two variables, we need to first graph the corresponding linear equation. The graph of $x+y=2$ is a line with slope $-1$ and $y$-intercept $2$:
[asy]
void axes(real x0, real x1, real y0, real y1)
{
draw((x0,0)--(x1,0),EndArrow);
draw((0,y0)--(0,y1),EndArrow);
label("$x$",(x1,0),E);
label("$y$",(0,y1),N);
for (int i=floor(x0)+1; i draw((i,.1)--(i,-.1));
for (int i=floor(y0)+1; i draw((.1,i)--(-.1,i));
}
size(200);
axes(-1,3,-1,3);
draw((0,2)--(2,0),Arrows);
label("$x+y=2$",(1.2,1.8),NE);
[/asy]
To determine which side of the line to shade, we pick a test point not on the line and check whether it satisfies the inequality. The easiest test point to use is usually the origin $(0,0)$, since it is easy to plug into the inequality. For $x+y<2$, we have $0+0<2$, which is true. Therefore, we shade the region below the line to indicate all the points that satisfy $x+y<2$.
[asy]
void axes(real x0, real x1, real y0, real y1)
{
draw((x0,0)--(x1,0),EndArrow);
draw((0,y0)--(0,y1),EndArrow);
label("$x$",(x1,0),E);
label("$y$",(0,y1),N);
for (int i=floor(x0)+1; i draw((i,.1)--(i,-.1));
for (int i=floor(y0)+1; i draw((.1,i)--(-.1,i));
}
size(200);
axes(-1,3,-1,3);
filldraw((0,0)--(2,0)--(0,2)--cycle,gray(.7));
draw((0,2)--(2,0),Arrows);
label("$x+y=2$",(1.2,1.8),NE);
[/asy]
Similarly, to graph $6x+2y>4$, we first graph the line $6x+2y=4$. This line has slope $-3$ and $y$-intercept $2$ (dividing both sides by $2$ gives $3x+y=2$):
[asy]
void axes(real x0, real x1, real y0, real y1)
{
draw((x0,0)--(x1,0),EndArrow);
draw((0,y0)--(0,y1),EndArrow);
label("$x$",(x1,0),E);
label("$y$",(0,y1),N);
for (int i=floor(x0)+1; i draw((i,.1)--(i,-.1));
for (int i=floor(y0)+1; i draw((.1,i)--(-.1,i));
}
size(200);
axes(-1,3,-1,3);
draw((0,2)--((2/3),0),Arrows);
label("$6x+2y=4$",(0.5,2),N);
[/asy]
To determine which side of the line to shade for $6x+2y>4$, we test the origin: $6(0)+2(0)=0<4$, so we shade the region above the line.
[asy]
void axes(real x0, real x1, real y0, real y1)
{
draw((x0,0)--(x1,0),EndArrow);
draw((0,y0)--(0,y1),EndArrow);
label("$x$",(x1,0),E);
label("$y$",(0,y1),N);
for (int i=floor(x0)+1; i draw((i,.1)--(i,-.1));
for (int i=floor(y0)+1; i draw((.1,i)--(-.1,i));
}
size(200);
axes(-1,3,-1,3);
filldraw((0,2)--((2/3),0)--(2,2)--cycle,gray(.7));
draw((0,2)--((2/3),0),Arrows);
label("$6x+2y=4$",(0.5,2),N);
[/asy]
Putting the two graphs together, we shade the region that satisfies both inequalities:
[asy]
void axes(real x0, real x1, real y0, real y1)
{
draw((x0,0)--(x1,0),EndArrow);
draw((0,y0)--(0,y1),EndArrow);
label("$x$",(x1,0),E);
label("$y$",(0,y1),N);
for (int i=floor(x0)+1; i draw((i,.1)--(i,-.1));
for (int i=floor(y0)+1; i draw((.1,i)--(-.1,i));
}
size(200);
axes(-1,3,-1,3);
filldraw((0,2)--((2/3),0)--(2,2)--cycle,gray(.7));
draw((0,2)--((2/3),0),Arrows);
draw((0,2)--(2,0),Arrows);
label("$6x+2y=4$",(0.5,2),N);
label("$x+y=2$",(1.2,1.8),NE);
[/asy]
The only choice that matches this graph is $\boxed{\textbf{(B)}}$.
[asy]
void axes(real x0, real x1, real y0, real y1)
{
draw((x0,0)--(x1,0),EndArrow);
draw((0,y0)--(0,y1),EndArrow);
label("$x$",(x1,0),E);
label("$y$",(0,y1),N);
for (int i=floor(x0)+1; i draw((i,.1)--(i,-.1));
for (int i=floor(y0)+1; i draw((.1,i)--(-.1,i));
}
size(200);
axes(-1,3,-1,3);
draw((0,2)--(2,0),Arrows);
label("$x+y=2$",(1.2,1.8),NE);
[/asy]
To determine which side of the line to shade, we pick a test point not on the line and check whether it satisfies the inequality. The easiest test point to use is usually the origin $(0,0)$, since it is easy to plug into the inequality. For $x+y<2$, we have $0+0<2$, which is true. Therefore, we shade the region below the line to indicate all the points that satisfy $x+y<2$.
[asy]
void axes(real x0, real x1, real y0, real y1)
{
draw((x0,0)--(x1,0),EndArrow);
draw((0,y0)--(0,y1),EndArrow);
label("$x$",(x1,0),E);
label("$y$",(0,y1),N);
for (int i=floor(x0)+1; i draw((i,.1)--(i,-.1));
for (int i=floor(y0)+1; i draw((.1,i)--(-.1,i));
}
size(200);
axes(-1,3,-1,3);
filldraw((0,0)--(2,0)--(0,2)--cycle,gray(.7));
draw((0,2)--(2,0),Arrows);
label("$x+y=2$",(1.2,1.8),NE);
[/asy]
Similarly, to graph $6x+2y>4$, we first graph the line $6x+2y=4$. This line has slope $-3$ and $y$-intercept $2$ (dividing both sides by $2$ gives $3x+y=2$):
[asy]
void axes(real x0, real x1, real y0, real y1)
{
draw((x0,0)--(x1,0),EndArrow);
draw((0,y0)--(0,y1),EndArrow);
label("$x$",(x1,0),E);
label("$y$",(0,y1),N);
for (int i=floor(x0)+1; i draw((i,.1)--(i,-.1));
for (int i=floor(y0)+1; i draw((.1,i)--(-.1,i));
}
size(200);
axes(-1,3,-1,3);
draw((0,2)--((2/3),0),Arrows);
label("$6x+2y=4$",(0.5,2),N);
[/asy]
To determine which side of the line to shade for $6x+2y>4$, we test the origin: $6(0)+2(0)=0<4$, so we shade the region above the line.
[asy]
void axes(real x0, real x1, real y0, real y1)
{
draw((x0,0)--(x1,0),EndArrow);
draw((0,y0)--(0,y1),EndArrow);
label("$x$",(x1,0),E);
label("$y$",(0,y1),N);
for (int i=floor(x0)+1; i draw((i,.1)--(i,-.1));
for (int i=floor(y0)+1; i draw((.1,i)--(-.1,i));
}
size(200);
axes(-1,3,-1,3);
filldraw((0,2)--((2/3),0)--(2,2)--cycle,gray(.7));
draw((0,2)--((2/3),0),Arrows);
label("$6x+2y=4$",(0.5,2),N);
[/asy]
Putting the two graphs together, we shade the region that satisfies both inequalities:
[asy]
void axes(real x0, real x1, real y0, real y1)
{
draw((x0,0)--(x1,0),EndArrow);
draw((0,y0)--(0,y1),EndArrow);
label("$x$",(x1,0),E);
label("$y$",(0,y1),N);
for (int i=floor(x0)+1; i draw((i,.1)--(i,-.1));
for (int i=floor(y0)+1; i draw((.1,i)--(-.1,i));
}
size(200);
axes(-1,3,-1,3);
filldraw((0,2)--((2/3),0)--(2,2)--cycle,gray(.7));
draw((0,2)--((2/3),0),Arrows);
draw((0,2)--(2,0),Arrows);
label("$6x+2y=4$",(0.5,2),N);
label("$x+y=2$",(1.2,1.8),NE);
[/asy]
The only choice that matches this graph is $\boxed{\textbf{(B)}}$.

Learning Objectives
- Plot systems of linear inequalities with two variables on a graph.