Asked by Louella Jackson on Jul 17, 2024

Verified
Hemo-tech, Inc., a biomedical technology and research laboratory, produces a standard blood filtering device on an assembly line basis. Six basic tasks are performed along an assembly line. The time to perform each task and the tasks that must immediately precede each task are in the table below. Twenty pumps per 450-minute day must be produced by the assembly line.
Task Immediate Predecessors Time to perform (min.) A−−5.40 B A3.20 C −−1.50DB,C2.80ED17.10 F E12.80\begin{array} { | c | c | c | } \hline \text { Task } & \begin{array} { c } \text { Immediate } \\\text { Predecessors }\end{array} & \begin{array} { c } \text { Time to perform } \\\text { (min.) }\end{array} \\\hline \mathrm { A } & - - & 5.40 \\\hline \text { B } & \mathrm { A } & 3.20 \\\hline \text { C } & - - & 1.50 \\\hline \mathrm { D } & \mathrm { B } , \mathrm { C } & 2.80 \\\hline \mathrm { E } & \mathrm { D } & 17.10 \\\hline \text { F } & \mathrm { E } & 12.80 \\\hline\end{array} Task A B C DE F Immediate Predecessors −−A−−B,CDE Time to perform (min.) 5.403.201.502.8017.1012.80 a. Draw the network diagram of the precedence relationships.
b. Identify the absolute minimum and maximum cycle times.
c. How many workstations are required to meet the schedule?
d. What is the cycle time required to meet demand?
e. Balance this line using most following tasks heuristic.
f. What is the efficiency of the line obtained in part e?
g. Can the efficiency of this solution be improved? Explain.
Maximum Cycle Time
The longest allowable period for completing a cycle or process from start to finish.
Efficiency
The ratio of useful output to total input, indicating the effectiveness with which resources are converted into outputs.
Network Diagram
A graphical representation of tasks, activities, or projects showing their sequential relationships and dependencies.
- Comprehend and implement techniques for balancing assembly lines and compute their effectiveness, encompassing cycle time, the lowest number of workstations, and rules for line balancing.
- Acquire knowledge of and utilize strategies for effective assembly line architecture and management, highlighting the sequence of activities and planning of work assignments.

Verified Answer
AM
Anand mishraJul 19, 2024
Final Answer :
(a) The appropriate diagram appears below. (b) The absolute minimum cycle time is 17.10 minutes (the longest operation). The absolute maximum cycle time is 42.80 minutes (the sum of all task times). (c) The theoretical minimum number of stations is 42.8/22.5 = 1.90 or 2, but the actual number of stations needed is 3. (d) The required cycle time is 450/20 = 22.5 minutes. (e) The balanced line appears below. (f) The line's efficiency is only 63%. (g) There is idle time at all stations; removing the smallest amount of idle time (5.4 minutes) from all stations reduces the cycle time from 22.5 minutes to 17.1 minutes. The efficiency of the line rises to 83% 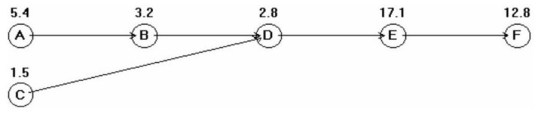 Station Task Time (minutes) Time left (minutes) Ready tasks #followers )A(4),C(3)1 A5.417.1C(3),B(3)C1.515.6 B(3)B3.212.4D(2)D2.89.6E(1)2E17.15.4 F(0)3 F12.89.7 Summa1y Statistics Cycle time 22.5 minutes Time allocated (cycle time * #) 67.5 minutes/cycle Time needed (sum of task times) 42.8 minutes/unit Idle time (allocated- needed) 24.7 minutes/cycle Efficiency (needed/allocated) 63.40741% Balance Delay (1- efficiency) 36.59259% Min (theoretical) # of stations 2\begin{array}{|l|l|l|l|l|}\hline\text { Station } & \text { Task } & \begin{array}{l}\text { Time } \\\text { (minutes) }\end{array} & \begin{array}{l}\text { Time left } \\\text { (minutes) }\end{array} & \begin{array}{l}\text { Ready tasks } \\\text { \#followers })\end{array} \\\hline & & & & \mathrm{A}(4), \mathrm{C}(3) \\\hline 1 & \mathrm{~A} & 5.4 & 17.1 & \mathrm{C}(3), \mathrm{B}(3) \\\hline & \mathrm{C} & 1.5 & 15.6 & \mathrm{~B}(3) \\\hline & \mathrm{B} & 3.2 & 12.4 & \mathrm{D}(2)\\\hline & \mathrm{D} & 2.8 & 9.6 & \mathrm{E}(1) \\\hline 2 & \mathrm{E} & 17.1 & 5.4 & \mathrm{~F}(0) \\\hline 3 & \mathrm{~F} & 12.8 & 9.7 & \\\hline \text { Summa1y Statistics } & & & & \\\hline \text { Cycle time } & 22.5 & \text { minutes } \\\hline \text { Time allocated (cycle } & & \\\text { time * \#) } & 67.5 & \text { minutes/cycle } \\\hline \text { Time needed (sum of task } & & \\\text { times) } & 42.8 & \text { minutes/unit } \\\hline \text { Idle time (allocated- } & & \\\text { needed) } & 24.7 & \text { minutes/cycle } \\\hline \text { Efficiency } & \\\text { (needed/allocated) } & 63.40741 \% \\\hline \text { Balance Delay (1- } & \\\text { efficiency) } & 36.59259 \% \\\hline \text { Min (theoretical) \# of } & \\\text { stations } &2\\\hline\end{array} Station 123 Summa1y Statistics Cycle time Time allocated (cycle time * #) Time needed (sum of task times) Idle time (allocated- needed) Efficiency (needed/allocated) Balance Delay (1- efficiency) Min (theoretical) # of stations Task ACBDE F22.567.542.824.763.40741%36.59259%2 Time (minutes) 5.41.53.22.817.112.8 minutes minutes/cycle minutes/unit minutes/cycle Time left (minutes) 17.115.612.49.65.49.7 Ready tasks #followers )A(4),C(3)C(3),B(3) B(3)D(2)E(1) F(0) Station Task Time (minutes) Time left (minutes) Readk. tasks 1 A5.411.7C(3),B(3)C1.510.2 B(3)B3.27D(2)D2.84.2E(1)2E17.10.F(0)3F12.84.3 Summary Statistics Cycle time 17.1 minutes Time allocated (cycle time * #) 51.3 minutes/cycle Time needed (sum of task times) 42.8 minutes/unit Idle time (allocated- needed) 8.500004 minutes/cycle Efficiency (needed/allocated) 83.43079% Balance Delay (1- efficiency) 16.56921% Min (theoretical) # of stations 2\begin{array}{|l|l|l|l|l|}\hline\text { Station } & \text { Task } & \begin{array}{l}\text { Time } \\\text { (minutes) }\end{array} & \begin{array}{l}\text { Time left } \\\text { (minutes) }\end{array} & \begin{array}{l}\text { Readk. } \\\text { tasks }\end{array} \\\hline 1 & \mathrm{~A} & 5.4 & 11.7 & \mathrm{C}(3), \mathrm{B}(3) \\\hline &\mathrm{C} & 1.5 & 10.2 & \mathrm{~B}(3) \\\hline &\mathrm{B} & 3.2 & 7 & \mathrm{D}(2) \\\hline &\mathrm{D} & 2.8 & 4.2 & \mathrm{E}(1) \\\hline 2&\mathrm{E} & 17.1 & 0 . & \mathrm{F}(0) \\\hline 3&\mathrm{F} & 12.8 & 4.3 & \\\hline \text { Summary Statistics } & & \\\hline \text { Cycle time } & 17.1 & \text { minutes } \\\hline \text { Time allocated (cycle } & & \\\text { time * \#) } & 51.3 & \text { minutes/cycle }\\\hline\text { Time needed (sum of task } & & \\\text { times) } & 42.8 & \text { minutes/unit } \\\hline \text { Idle time (allocated- } & & \\\text { needed) } & 8.500004 & \text { minutes/cycle } \\\hline \text { Efficiency } & \\\text { (needed/allocated) } & 83.43079 \% \\\hline \begin{array}{l}\text { Balance Delay (1- } \\\text { efficiency) }\end{array} & 16.56921 \% \\\hline \begin{array}{l}\text { Min (theoretical) \# of } \\\text { stations }\end{array} &2\\\hline\end{array} Station 123 Summary Statistics Cycle time Time allocated (cycle time * #) Time needed (sum of task times) Idle time (allocated- needed) Efficiency (needed/allocated) Balance Delay (1- efficiency) Min (theoretical) # of stations Task ACBDEF17.151.342.88.50000483.43079%16.56921%2 Time (minutes) 5.41.53.22.817.112.8 minutes minutes/cycle minutes/unit minutes/cycle Time left (minutes) 11.710.274.20.4.3 Readk. tasks C(3),B(3) B(3)D(2)E(1)F(0)
Station Task Time (minutes) Time left (minutes) Ready tasks #followers )A(4),C(3)1 A5.417.1C(3),B(3)C1.515.6 B(3)B3.212.4D(2)D2.89.6E(1)2E17.15.4 F(0)3 F12.89.7 Summa1y Statistics Cycle time 22.5 minutes Time allocated (cycle time * #) 67.5 minutes/cycle Time needed (sum of task times) 42.8 minutes/unit Idle time (allocated- needed) 24.7 minutes/cycle Efficiency (needed/allocated) 63.40741% Balance Delay (1- efficiency) 36.59259% Min (theoretical) # of stations 2\begin{array}{|l|l|l|l|l|}\hline\text { Station } & \text { Task } & \begin{array}{l}\text { Time } \\\text { (minutes) }\end{array} & \begin{array}{l}\text { Time left } \\\text { (minutes) }\end{array} & \begin{array}{l}\text { Ready tasks } \\\text { \#followers })\end{array} \\\hline & & & & \mathrm{A}(4), \mathrm{C}(3) \\\hline 1 & \mathrm{~A} & 5.4 & 17.1 & \mathrm{C}(3), \mathrm{B}(3) \\\hline & \mathrm{C} & 1.5 & 15.6 & \mathrm{~B}(3) \\\hline & \mathrm{B} & 3.2 & 12.4 & \mathrm{D}(2)\\\hline & \mathrm{D} & 2.8 & 9.6 & \mathrm{E}(1) \\\hline 2 & \mathrm{E} & 17.1 & 5.4 & \mathrm{~F}(0) \\\hline 3 & \mathrm{~F} & 12.8 & 9.7 & \\\hline \text { Summa1y Statistics } & & & & \\\hline \text { Cycle time } & 22.5 & \text { minutes } \\\hline \text { Time allocated (cycle } & & \\\text { time * \#) } & 67.5 & \text { minutes/cycle } \\\hline \text { Time needed (sum of task } & & \\\text { times) } & 42.8 & \text { minutes/unit } \\\hline \text { Idle time (allocated- } & & \\\text { needed) } & 24.7 & \text { minutes/cycle } \\\hline \text { Efficiency } & \\\text { (needed/allocated) } & 63.40741 \% \\\hline \text { Balance Delay (1- } & \\\text { efficiency) } & 36.59259 \% \\\hline \text { Min (theoretical) \# of } & \\\text { stations } &2\\\hline\end{array} Station 123 Summa1y Statistics Cycle time Time allocated (cycle time * #) Time needed (sum of task times) Idle time (allocated- needed) Efficiency (needed/allocated) Balance Delay (1- efficiency) Min (theoretical) # of stations Task ACBDE F22.567.542.824.763.40741%36.59259%2 Time (minutes) 5.41.53.22.817.112.8 minutes minutes/cycle minutes/unit minutes/cycle Time left (minutes) 17.115.612.49.65.49.7 Ready tasks #followers )A(4),C(3)C(3),B(3) B(3)D(2)E(1) F(0) Station Task Time (minutes) Time left (minutes) Readk. tasks 1 A5.411.7C(3),B(3)C1.510.2 B(3)B3.27D(2)D2.84.2E(1)2E17.10.F(0)3F12.84.3 Summary Statistics Cycle time 17.1 minutes Time allocated (cycle time * #) 51.3 minutes/cycle Time needed (sum of task times) 42.8 minutes/unit Idle time (allocated- needed) 8.500004 minutes/cycle Efficiency (needed/allocated) 83.43079% Balance Delay (1- efficiency) 16.56921% Min (theoretical) # of stations 2\begin{array}{|l|l|l|l|l|}\hline\text { Station } & \text { Task } & \begin{array}{l}\text { Time } \\\text { (minutes) }\end{array} & \begin{array}{l}\text { Time left } \\\text { (minutes) }\end{array} & \begin{array}{l}\text { Readk. } \\\text { tasks }\end{array} \\\hline 1 & \mathrm{~A} & 5.4 & 11.7 & \mathrm{C}(3), \mathrm{B}(3) \\\hline &\mathrm{C} & 1.5 & 10.2 & \mathrm{~B}(3) \\\hline &\mathrm{B} & 3.2 & 7 & \mathrm{D}(2) \\\hline &\mathrm{D} & 2.8 & 4.2 & \mathrm{E}(1) \\\hline 2&\mathrm{E} & 17.1 & 0 . & \mathrm{F}(0) \\\hline 3&\mathrm{F} & 12.8 & 4.3 & \\\hline \text { Summary Statistics } & & \\\hline \text { Cycle time } & 17.1 & \text { minutes } \\\hline \text { Time allocated (cycle } & & \\\text { time * \#) } & 51.3 & \text { minutes/cycle }\\\hline\text { Time needed (sum of task } & & \\\text { times) } & 42.8 & \text { minutes/unit } \\\hline \text { Idle time (allocated- } & & \\\text { needed) } & 8.500004 & \text { minutes/cycle } \\\hline \text { Efficiency } & \\\text { (needed/allocated) } & 83.43079 \% \\\hline \begin{array}{l}\text { Balance Delay (1- } \\\text { efficiency) }\end{array} & 16.56921 \% \\\hline \begin{array}{l}\text { Min (theoretical) \# of } \\\text { stations }\end{array} &2\\\hline\end{array} Station 123 Summary Statistics Cycle time Time allocated (cycle time * #) Time needed (sum of task times) Idle time (allocated- needed) Efficiency (needed/allocated) Balance Delay (1- efficiency) Min (theoretical) # of stations Task ACBDEF17.151.342.88.50000483.43079%16.56921%2 Time (minutes) 5.41.53.22.817.112.8 minutes minutes/cycle minutes/unit minutes/cycle Time left (minutes) 11.710.274.20.4.3 Readk. tasks C(3),B(3) B(3)D(2)E(1)F(0)
Learning Objectives
- Comprehend and implement techniques for balancing assembly lines and compute their effectiveness, encompassing cycle time, the lowest number of workstations, and rules for line balancing.
- Acquire knowledge of and utilize strategies for effective assembly line architecture and management, highlighting the sequence of activities and planning of work assignments.