Asked by Kassy Lazcano on May 31, 2024

Verified
A firm is planning to set up an assembly line to assemble 40 units per hour, and 57 minutes per hour are productive. The time to perform each task and the tasks which precede each task are:
Task Preceding Task Time to perform (min.) A−−.69BA.55CB.92DB.59EB.70FB1.10GC,D,E.75HG,F.43IH.29\begin{array} { | c | c | c | } \hline \text { Task } & \begin{array} { c } \text { Preceding } \\\text { Task }\end{array} & \begin{array} { c } \text { Time to } \\\text { perform (min.) }\end{array} \\\hline \mathrm { A } & - - & .69 \\\hline \mathrm { B } & \mathrm { A } & .55 \\\hline \mathrm { C } & \mathrm { B } & .92 \\\hline \mathrm { D } & \mathrm { B } & .59 \\\hline \mathrm { E } & \mathrm { B } & .70 \\\hline \mathrm { F } & \mathrm { B } & 1.10 \\\hline \mathrm { G } & \mathrm { C } , \mathrm { D } , \mathrm { E } & .75 \\\hline \mathrm { H } & \mathrm { G } , \mathrm { F } & .43 \\\hline \mathrm { I } & \mathrm { H } & .29 \\\hline\end{array} Task ABCDEFGHI Preceding Task −−ABBBBC,D,EG,FH Time to perform (min.) .69.55.92.59.701.10.75.43.29 a. Draw a network diagram of precedence relationships.
b. Compute the required cycle time per unit in minutes.
c. Compute the theoretical minimum number of workstations required to produce 40 units per hour.
d. Balance this line using longest processing time.
e. What is the efficiency of the line obtained in part d?
Cycle Time
The total time from the beginning to the end of a process, including process and wait times, indicating the speed of production.
- Learn to apply and assess assembly line balancing techniques, calculating their efficiency, which includes cycle time, the lowest possible number of workstations, and heuristics for balancing the line.
- Learn and apply approaches for efficient assembly line structuring and operations, focusing on task sequencing and the distribution of work assignments.

Verified Answer
SM
swapnil mohaneJun 05, 2024
Final Answer :
(a) The appropriate diagram appears below. (b) Cycle time is 57/40 = 1.425 minutes. (c) The theoretical minimum number of stations required is 6.02/1.425 = 4.22 or 5. (d) The balanced line appears in the software output panel below. (e) The line's efficiency is 6.02 / 8.55 = 70.4% 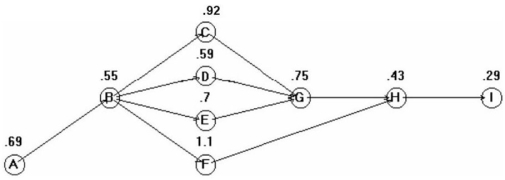 Station Task Time (minutes) Time left (minutes) Ready tasks A1 A 0.690.735 BB0.550.185C,D,E,F2 F1.10.325C,D,E3C0.920.505D,E4E0.70.725DD0.590.135G5G0.750.675HH0.430.245I6I0.291.135 Summary Statistics Cycle time 1.425 minutes Time allocated (cycle time*#) 8.549999 minutes/cycle Time needed (sum of task times) 6.02 minutes/unit Tdle time (allocated- needed) −.529999 minutes/cycle Efficiency (needed/allocated) 70.40936% Balance Delay (1- efficiency) 29.59064% Min (theoretical) # of stations 5\begin{array}{|l|l|l|l|l|}\hline\text { Station } & \text { Task } & \begin{array}{l}\text { Time } \\\text { (minutes) }\end{array} & \begin{array}{l}\text { Time left } \\\text { (minutes) }\end{array} & \begin{array}{l}\text { Ready } \\\text { tasks }\end{array} \\\hline & & & & \mathbf{A} \\\hline 1 & \text { A } & 0.69 & 0.735 & \mathrm{~B} \\\hline& \mathrm{B} & 0.55 & 0.185 & \mathrm{C}, \mathrm{D}, \mathrm{E}, \mathrm{F} \\\hline 2 & \mathrm{~F} & 1.1 & 0.325 & \mathrm{C}, \mathrm{D}, \mathrm{E} \\\hline 3 & \mathrm{C} & 0.92 & 0.505 & \mathrm{D}, \mathrm{E} \\\hline 4 & \mathrm{E} & 0.7 & 0.725 & \mathrm{D} \\\hline & \mathrm{D} & 0.59 & 0.135 & \mathrm{G} \\\hline 5 & \mathrm{G} & 0.75 & 0.675 & \mathrm{H} \\\hline & \mathrm{H} & 0.43 & 0.245 & \mathrm{I} \\\hline 6 & \mathrm{I} & 0.29 & 1.135 & \\\hline \text { Summary Statistics } & & & & \\\hline \text { Cycle time } & 1.425 & \text { minutes } & & \\\hline\text { Time allocated (cycle } & & & & \\\text { time*\#) } & 8.549999 & \text { minutes/cycle } & & \\\hline \text { Time needed (sum of } & & & & \\\text { task times) } & 6.02 & \text { minutes/unit } & & \\\hline \text { Tdle time (allocated- } & & \\\text { needed) } & -.529999 & \text { minutes/cycle } \\\hline \text { Efficiency } & & \\\text { (needed/allocated) } & 70.40936 \% & \\\hline \text { Balance Delay (1- } & & \\\text { efficiency) } & 29.59064 \% & \\\hline \begin{array}{l}\text { Min (theoretical) \# of } \\\text { stations }\end{array} & 5&\\\hline\end{array} Station 123456 Summary Statistics Cycle time Time allocated (cycle time*#) Time needed (sum of task times) Tdle time (allocated- needed) Efficiency (needed/allocated) Balance Delay (1- efficiency) Min (theoretical) # of stations Task A B FCEDGHI1.4258.5499996.02−.52999970.40936%29.59064%5 Time (minutes) 0.690.551.10.920.70.590.750.430.29 minutes minutes/cycle minutes/unit minutes/cycle Time left (minutes) 0.7350.1850.3250.5050.7250.1350.6750.2451.135 Ready tasks A BC,D,E,FC,D,ED,EDGHI
Station Task Time (minutes) Time left (minutes) Ready tasks A1 A 0.690.735 BB0.550.185C,D,E,F2 F1.10.325C,D,E3C0.920.505D,E4E0.70.725DD0.590.135G5G0.750.675HH0.430.245I6I0.291.135 Summary Statistics Cycle time 1.425 minutes Time allocated (cycle time*#) 8.549999 minutes/cycle Time needed (sum of task times) 6.02 minutes/unit Tdle time (allocated- needed) −.529999 minutes/cycle Efficiency (needed/allocated) 70.40936% Balance Delay (1- efficiency) 29.59064% Min (theoretical) # of stations 5\begin{array}{|l|l|l|l|l|}\hline\text { Station } & \text { Task } & \begin{array}{l}\text { Time } \\\text { (minutes) }\end{array} & \begin{array}{l}\text { Time left } \\\text { (minutes) }\end{array} & \begin{array}{l}\text { Ready } \\\text { tasks }\end{array} \\\hline & & & & \mathbf{A} \\\hline 1 & \text { A } & 0.69 & 0.735 & \mathrm{~B} \\\hline& \mathrm{B} & 0.55 & 0.185 & \mathrm{C}, \mathrm{D}, \mathrm{E}, \mathrm{F} \\\hline 2 & \mathrm{~F} & 1.1 & 0.325 & \mathrm{C}, \mathrm{D}, \mathrm{E} \\\hline 3 & \mathrm{C} & 0.92 & 0.505 & \mathrm{D}, \mathrm{E} \\\hline 4 & \mathrm{E} & 0.7 & 0.725 & \mathrm{D} \\\hline & \mathrm{D} & 0.59 & 0.135 & \mathrm{G} \\\hline 5 & \mathrm{G} & 0.75 & 0.675 & \mathrm{H} \\\hline & \mathrm{H} & 0.43 & 0.245 & \mathrm{I} \\\hline 6 & \mathrm{I} & 0.29 & 1.135 & \\\hline \text { Summary Statistics } & & & & \\\hline \text { Cycle time } & 1.425 & \text { minutes } & & \\\hline\text { Time allocated (cycle } & & & & \\\text { time*\#) } & 8.549999 & \text { minutes/cycle } & & \\\hline \text { Time needed (sum of } & & & & \\\text { task times) } & 6.02 & \text { minutes/unit } & & \\\hline \text { Tdle time (allocated- } & & \\\text { needed) } & -.529999 & \text { minutes/cycle } \\\hline \text { Efficiency } & & \\\text { (needed/allocated) } & 70.40936 \% & \\\hline \text { Balance Delay (1- } & & \\\text { efficiency) } & 29.59064 \% & \\\hline \begin{array}{l}\text { Min (theoretical) \# of } \\\text { stations }\end{array} & 5&\\\hline\end{array} Station 123456 Summary Statistics Cycle time Time allocated (cycle time*#) Time needed (sum of task times) Tdle time (allocated- needed) Efficiency (needed/allocated) Balance Delay (1- efficiency) Min (theoretical) # of stations Task A B FCEDGHI1.4258.5499996.02−.52999970.40936%29.59064%5 Time (minutes) 0.690.551.10.920.70.590.750.430.29 minutes minutes/cycle minutes/unit minutes/cycle Time left (minutes) 0.7350.1850.3250.5050.7250.1350.6750.2451.135 Ready tasks A BC,D,E,FC,D,ED,EDGHI
Learning Objectives
- Learn to apply and assess assembly line balancing techniques, calculating their efficiency, which includes cycle time, the lowest possible number of workstations, and heuristics for balancing the line.
- Learn and apply approaches for efficient assembly line structuring and operations, focusing on task sequencing and the distribution of work assignments.
Related questions
Hemo-Tech, Inc A Draw the Network Diagram of the Precedence ...
A Production Line Is to Be Designed for a Product ...
In Assembly Line Balancing, the Theoretical Minimum Number of Workstations ...
An Assembly Line with 11 Tasks Is to Be Balanced ...
A Work Cell Is Required to Make 140 Computerized Diagnostic ...