Asked by Chris James on May 11, 2024

Verified
Use the graphical approach to CVP analysis to solve the following problem.
Valley Peat Ltd. sells peat moss for $10 per bag. Variable costs are $7.50 per bag and annual fixed costs are $100,000.
a) How many bags of peat must be sold to break even?
b) What will be the net income for a year in which 60,000 bags of peat are sold?
c) How many bags must be sold for a net income of $60,000 in a year?
d) What volume of sales would produce a loss of $10,000?
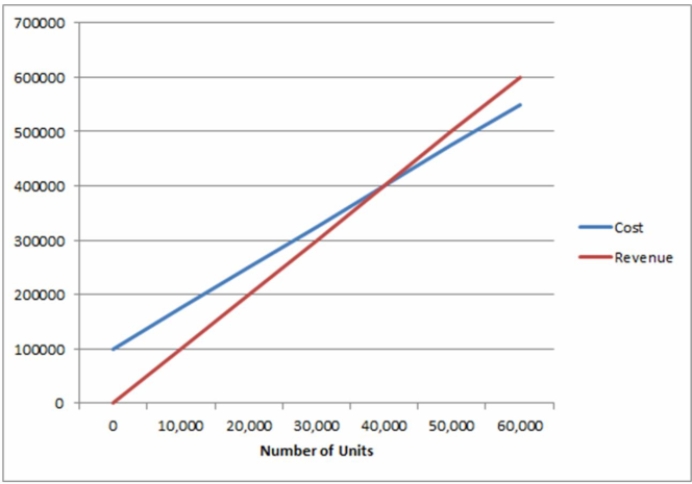
Graphical Approach
A method of solving problems or illustrating concepts by using diagrams, charts, or graphs.
CVP Analysis
Cost-Volume-Profit Analysis is a method used in managerial accounting to analyze how revenues, costs, and profits change with variations in sales volume.
Net Income
The net income of a company, which is calculated by deducting all expenses, taxes, and costs from its total earnings.
- Establish the equilibrium point for a product or service in terms of both units and revenue.
- Apply the graphical approach to Cost-Volume-Profit (CVP) analysis.
- Compute the requisite sales figure to meet a specific financial target, encompassing both breaking even and obtaining a predetermined net income.

Verified Answer
b) $50,000
c) 64,000 bags/year
d) 36,000 bags/year

Learning Objectives
- Establish the equilibrium point for a product or service in terms of both units and revenue.
- Apply the graphical approach to Cost-Volume-Profit (CVP) analysis.
- Compute the requisite sales figure to meet a specific financial target, encompassing both breaking even and obtaining a predetermined net income.
Related questions
Larissa Manufactures Rings Which Sell in Her Boutique for $60 ...
M Studios Estimates That It Can Sell 1,500 Camera Lenses ...
A Company Expects to Sell 30,000 Ball Hats at $35 ...
A Small Business Calculates That Its Monthly Fixed Costs Are ...
Use the Graphical Approach to CVP Analysis to Solve the ...