Asked by Maggie Jones on May 30, 2024

Verified
Use the graphical approach to CVP analysis to solve the following problem.
Reflex Manufacturing Corp. manufactures borgels at a unit variable cost of $43. It sells them for $70 each. It can produce a maximum of 3,200 borgels per month. Annual fixed costs total $648,000.
a) What is the break-even volume per month?
b) What is the monthly net income at a volume of 2500 borgels per month?
c) What is the monthly net income if Reflex operates at 50% of capacity during a recession?
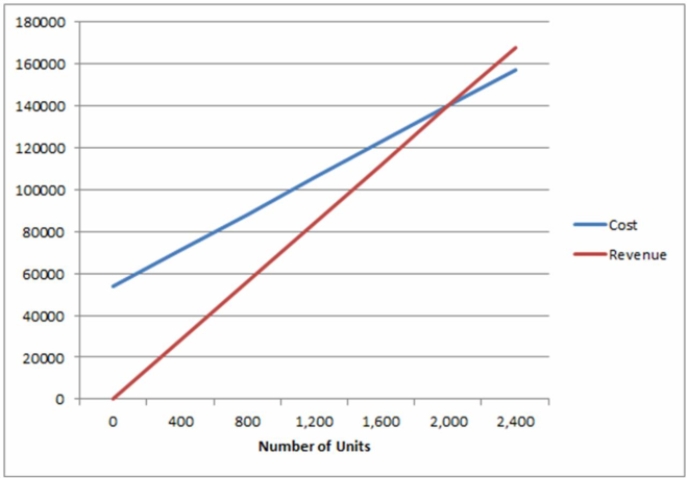
Graphical Approach
A method of solving problems or representing data using diagrams, charts, or graphs.
CVP Analysis
Cost-Volume-Profit Analysis, a management accounting methodology used for understanding the relationship between costs, volumes of sales, and profit.
Variable Cost
Costs that vary in proportion to the level of activity or volume of production in a business.
- Calculate the juncture at which a product or service's units sold equals its expenses in terms of units and revenue.
- Utilize the graphical technique for analyzing Cost-Volume-Profit (CVP) dynamics.
- Ascertain the amount of sales needed to fulfill a particular financial aim, including achieving a break-even status or securing a desired net income.

Verified Answer
ZK

Learning Objectives
- Calculate the juncture at which a product or service's units sold equals its expenses in terms of units and revenue.
- Utilize the graphical technique for analyzing Cost-Volume-Profit (CVP) dynamics.
- Ascertain the amount of sales needed to fulfill a particular financial aim, including achieving a break-even status or securing a desired net income.
Related questions
Larissa Manufactures Rings Which Sell in Her Boutique for $60 ...
A Small Business Calculates That Its Monthly Fixed Costs Are ...
Use the Graphical Approach to CVP Analysis to Solve the ...
A Company Expects to Sell 30,000 Ball Hats at $35 ...
M Studios Estimates That It Can Sell 1,500 Camera Lenses ...