Asked by Alejandra Veloz on May 10, 2024

Verified
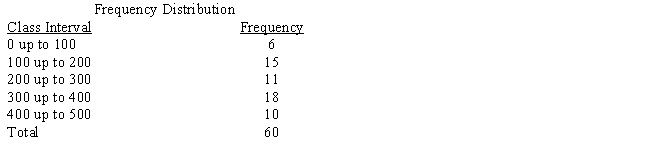
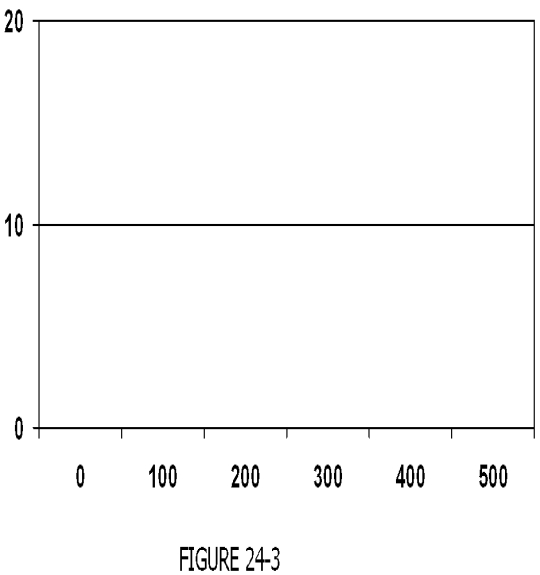
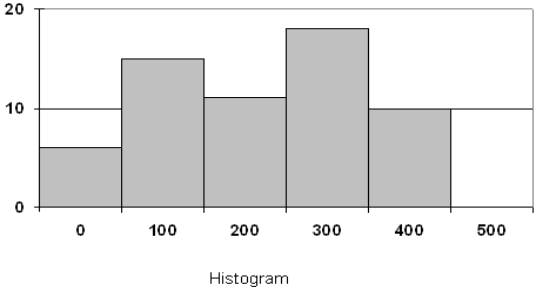
Use Figure 24-3 to construct a histogram for the frequency distribution in the table below. Label where necessary.
Histogram
A graphical representation of data that groups numbers into ranges, showing the frequency of data points within those ranges as bars.
Frequency Distribution
A statistical representation showing the number of observations within different intervals or categories.
- Construct graphical displays of information by employing histograms.

Verified Answer
KM

Learning Objectives
- Construct graphical displays of information by employing histograms.
Related questions
Enrico Vaselli Owns Enrico's European Shoe Store, a Chain of ...
Use the Frequency Distribution Shown Below and Figure 24-1 to ...
In June, Karen Henderson, an Accountant, Examined Her Records to ...
Owners of a New Appliances Store Tracked Sales (In Thousands)for ...
The Following Table Gives the Total Sales (Revenue)and Profits for ...