Asked by Salma Tawfic on Jun 04, 2024

Verified
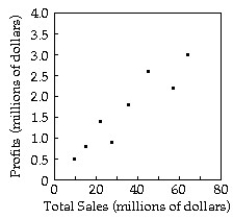
The following table gives the total sales (revenue)and profits for 8 retailers. Company Total Sales (Millions of $) Profits (Millions of $) Adams 45.02.6 Brown 15.00.8 Clay 57.02.2 Donner 9.50.5 Esters 22.01.4 Framer 35.01.8 Gillies 64.03.0 Hays 27.50.9\begin{array} { l c c } \hline \text { Company } & \begin{array} { c } \text { Total Sales } \\\text { (Millions of \$) }\end{array} & \begin{array} { c } \text { Profits } \\\text { (Millions of \$) }\end{array} \\\hline \text { Adams } & 45.0 & 2.6 \\\text { Brown } & 15.0 & 0.8 \\\text { Clay } & 57.0 & 2.2 \\\text { Donner } & 9.5 & 0.5 \\\text { Esters } & 22.0 & 1.4 \\\text { Framer } & 35.0 & 1.8 \\\text { Gillies } & 64.0 & 3.0 \\\text { Hays } & 27.5 & 0.9 \\\hline\end{array} Company Adams Brown Clay Donner Esters Framer Gillies Hays Total Sales (Millions of $) 45.015.057.09.522.035.064.027.5 Profits (Millions of $) 2.60.82.20.51.41.83.00.9
Total Sales
The collective amount of revenue generated from goods or services sold by a company within a specific period.
Profits
The financial gain realized when the amount of revenue gained from a business activity exceeds the expenses, costs, and taxes.
Millions of \$
A numerical measure or quantity denoted in units of a million dollars, often used in financial contexts.
- Evaluate the significance of associations in real-life scenarios, such as academic performance or sales data.
- Develop ability to construct and interpret histograms for data visualization.

Verified Answer

Learning Objectives
- Evaluate the significance of associations in real-life scenarios, such as academic performance or sales data.
- Develop ability to construct and interpret histograms for data visualization.
Related questions
Owners of a New Appliances Store Tracked Sales (In Thousands)for ...
In June, Karen Henderson, an Accountant, Examined Her Records to ...
Use Figure 24-3 to Construct a Histogram for the Frequency ...
Enrico Vaselli Owns Enrico's European Shoe Store, a Chain of ...
Use the Frequency Distribution Shown Below and Figure 24-1 to ...