Asked by Grethel Hodovanec on May 18, 2024

Verified
The histogram shows the sizes (in acres) of 169 farms in Ontario.In addition to describing the distribution,approximate the percentage of farms that are under 100 acres. 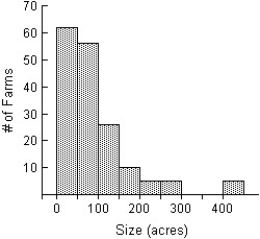
A) The distribution of the size of farms in Ontario is skewed to the right.Most of the farms are smaller than 150 acres,with some larger ones,from 150 to 300 acres.Five farms were larger than the rest,over 400 acres.The mode of the distribution is between 0 and 50 acres.It appears that 118 of 169 farms are under 100 acres,approximately 70%.
B) The distribution of the size of farms in Ontario is symmetric,with farm sizes ranging from 0 to 450 acres.The mode of the distribution is between 0 and 50 acres.It appears that 118 of 169 farms are under 100 acres,approximately 70%.
C) The distribution of the size of farms in Ontario is symmetric,with farm sizes ranging from 0 to 450 acres.The mode of the distribution is between 100 and 150 acres.It appears that 118 of 169 farms are under 100 acres,approximately 70%.
D) The distribution of the size of farms in Ontario is skewed to the right.Most of the farms are smaller than 50 acres,with some larger ones,from 150 to 300 acres.Five farms were larger than the rest,over 400 acres.The mode of the distribution is between 0 and 50 acres.It appears that 118 of 169 farms are under 100 acres,approximately 70%.
E) The distribution of the size of farms in Ontario is skewed to the right.Most of the farms are smaller than 150 acres,with some larger ones,from 150 to 300 acres.Five farms were larger than the rest,over 400 acres.The mode of the distribution is between 0 and 50 acres.It appears that 62 of 169 farms are under 100 acres,approximately 37%.
Histogram
A graphical representation of the distribution of numerical data, using bars to show the frequency of data in successive numerical intervals of equal size.
Skewed
Describes a distribution that is not symmetrical, with data points that are more frequent on one side than the other.
Acres
A unit of area used primarily in the United States, equal to 4,840 square yards or about 4,047 square meters.
- Master the skill of explicating and discerning the profile of distributions in histograms.

Verified Answer
May 22, 2024

Learning Objectives
- Master the skill of explicating and discerning the profile of distributions in histograms.
Related questions
The Display Shows the Heights of Grade 12 Students at ...
A Weight-Loss Company Used the Following Histogram to Show the ...
In May 2014,17 Coffee Shops in Toronto Charged the Following \[\begin{array} ...
The Intervals (Classes)in a Histogram Are Equally Wide
A Histogram Is Said to Be Symmetric If,when We Draw ...