Asked by Filip Gabric on Jun 17, 2024

Verified
The display shows the heights of Grade 12 students at a local high school,collected so that the students could be arranged with shorter ones in front and taller ones in back for a class photograph.In addition to describing the distribution,give a reason to account for the shape of this distribution. 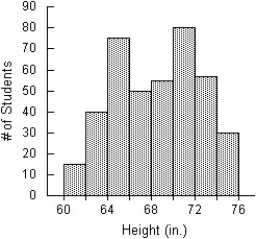
A) The distribution of the heights of Grade 12 students is bimodal,with a mode at around 65 inches and the other mode around 71 inches.The students' heights are between 60 inches and 74 inches.The two modes would likely represent the average heights of the male and female students.
B) The distribution of the heights of Grade 12 students is unimodal centred at 68,with a heights ranging from 60 inches to 76 inches.The two peaks would likely represent the average heights of the male and female students.
C) The distribution of the heights of Grade 12 students is bimodal,with a mode at around 62 inches and the other mode around 74 inches.No student has a height below 60 inches or above 76 inches.The two modes would likely represent the average heights of the male and female students.
D) The distribution of the heights of Grade 12 students is bimodal,with a mode at around 65 inches and the other mode around 71 inches.No student has a height below 60 inches or above 76 inches.The two modes would likely represent the average heights of the male and female students.
E) The distribution of the heights of Grade 12 students is uniform centred at 68,with a heights ranging from 60 inches to 76 inches.The two peaks would likely represent the average heights of the male and female students.
Heights
Measurements or distances from the base to the top of individuals or objects, often used in the context of recording physical stature.
Bimodal
Having two distinct peaks or modes in a distribution of data.
Grade 12
The final year of secondary school in many educational systems, often associated with preparing for college or university entry.
- Familiarize oneself with the approach for interpreting and describing the silhouette of distributions in histograms.
- Master the key concepts of bimodal, unimodal, symmetric, and skewed distributions along with their importance.
- Understand and interpret the concept of the mode in distributions.

Verified Answer
MW
Michael Wrobleski
Jun 23, 2024
Final Answer :
D
Explanation :
The description of the distribution mentions two modes, one at around 65 inches and the other around 71 inches, indicating the presence of two distinct groups of students with different heights. The fact that no student has a height below 60 inches or above 76 inches also suggests that these are the limits of the height range for Grade 12 students at this school. The explanation for this bimodal distribution could be that the two modes represent the average heights of male and female students, who typically have different growth patterns during their teenage years.

Learning Objectives
- Familiarize oneself with the approach for interpreting and describing the silhouette of distributions in histograms.
- Master the key concepts of bimodal, unimodal, symmetric, and skewed distributions along with their importance.
- Understand and interpret the concept of the mode in distributions.
Related questions
Number of Innings in the Baseball Games a Major League ...
A Weight-Loss Company Used the Following Histogram to Show the ...
Heights of Adult Women Attending a Concert ...
In May 2014,17 Coffee Shops in Toronto Charged the Following \[\begin{array} ...
The Histogram Shows the Sizes (In Acres)of 169 Farms in ...