Asked by Msgana Samson on May 16, 2024

Verified
The following statistics were calculated based on samples drawn from three normal populations: 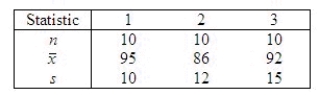 Set up the ANOVA table and test at the 5% level of significance to determine whether differences exist among the population means.
Test statistic = ______________
Critical Value(s) = ______________
Conclusion: ______________
Interpretation:
Differences ______________ exist among the population means.
Normal Populations
Populations where the distribution of the variable of interest is normally distributed, allowing the use of certain statistical techniques.
ANOVA Table
A table used to display the output of an Analysis of Variance, which shows statistical measures to test the hypothesis that multiple group means are equal.
Significance Level
The significance level, often denoted as alpha, is the threshold used to determine the statistical significance of an observed effect, typically set at 0.05 or 5%.
- Ascertain and explicate the relevance of the F-test statistic together with its corresponding p-value in the realm of one-way ANOVA.
- Detail the rejection region concept and the approach to null hypothesis rejection within one-way ANOVA.

Verified Answer

Learning Objectives
- Ascertain and explicate the relevance of the F-test statistic together with its corresponding p-value in the realm of one-way ANOVA.
- Detail the rejection region concept and the approach to null hypothesis rejection within one-way ANOVA.
Related questions
An Insurance Company Is Considering Opening a New Branch in ...
A Textile Company Is Interested in Knowing If There Is ...
Water Samples Were Taken at Four Different Locations in a ...
In ANOVA,the F-Test Is the Ratio of Two Sample Variances ...
The Following ANOVA Table Shows the Results of an Experiment ...