Asked by Eytan Weisz on Jun 03, 2024

Verified
The data in the table below can be used to explore the association between the rate of television ownership and per capita gross domestic product for several countries. TVs per 1000 per capita GDP (USD) Algeria 1055500 Australia 55423,200 China 3213,600 Dominican Republic 955,700 Hungary 43511,200 Italy 52822,100 Russia 4107,700 Syria 703,100 United States 80636,200\begin{array} { | l | c | c | } \hline & \text { TVs per } 1000 & \begin{array} { c } \text { per capita } \\\text { GDP (USD) }\end{array} \\\hline \text { Algeria } & 105 & 5500 \\\hline \text { Australia } & 554 & 23,200 \\\hline \text { China } & 321 & 3,600 \\\hline \text { Dominican } & & \\\text { Republic } & 95 & 5,700 \\\hline \text { Hungary } & 435 & 11,200 \\\hline \text { Italy } & 528 & 22,100 \\\hline \text { Russia } & 410 & 7,700 \\\hline \text { Syria } & 70 & 3,100 \\\hline \text { United States } & 806 & 36,200 \\\hline\end{array} Algeria Australia China Dominican Republic Hungary Italy Russia Syria United States TVs per 10001055543219543552841070806 per capita GDP (USD) 550023,2003,6005,70011,20022,1007,7003,10036,200 a)Make a scatterplot showing the trend in television ownership versus per capita GDP.Describe what you see.  b)Determine the correlation and comment on its significance.
c)Find the equation of the line of regression.Interpret the slope of the equation.
d)Use your model to predict the rate of TV ownership for India,which has a per capita GDP of $2,200.How much confidence do you have in this prediction? Explain.
e)Discuss the impact that the U.S.A.data exerts on the model.
Television Ownership
The state or fact of owning a television set, often considered in studies related to media consumption habits.
Per Capita GDP
A measure of a country's economic output that accounts for its number of people, essentially dividing the GDP by the population.
Scatterplot
A graph that uses dots to represent values obtained for two different variables, showing the relationship between them.
- Learn to decipher and employ regression analysis along with understanding the significance of coefficient values.
- Evaluate scatterplots for the purpose of identifying fitting models and trends.
- Understand the importance of correlation in practical datasets.

Verified Answer
BA
Bryce AllenJun 07, 2024
Final Answer :
a) 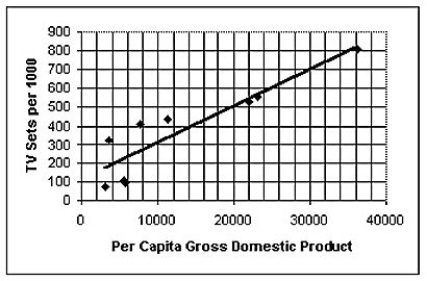 b)R2 = 0.8124.The association appears to be fairly strong. c)y = 0.0195x + 112.89.The rate of TV ownership increases by 0.0195 per thousand for each dollar increase in per capita GDP. d)155.8 TVs per 1000.This prediction cannot be given much confidence.While it is reasonable to expect an association between number of goods owned and per capita GDP,the linear model fails to account for cultural differences that affect interest in owning TV sets.Also,the model is heavily influenced by the data point for the United States,which is an outlier that exerts significant leverage on the model. e)The U.S.data point is an outlier in the x-variable and thus exerts significant leverage on the model.
b)R2 = 0.8124.The association appears to be fairly strong. c)y = 0.0195x + 112.89.The rate of TV ownership increases by 0.0195 per thousand for each dollar increase in per capita GDP. d)155.8 TVs per 1000.This prediction cannot be given much confidence.While it is reasonable to expect an association between number of goods owned and per capita GDP,the linear model fails to account for cultural differences that affect interest in owning TV sets.Also,the model is heavily influenced by the data point for the United States,which is an outlier that exerts significant leverage on the model. e)The U.S.data point is an outlier in the x-variable and thus exerts significant leverage on the model.
Learning Objectives
- Learn to decipher and employ regression analysis along with understanding the significance of coefficient values.
- Evaluate scatterplots for the purpose of identifying fitting models and trends.
- Understand the importance of correlation in practical datasets.