Asked by Neisha Bethly on Jun 13, 2024

Verified
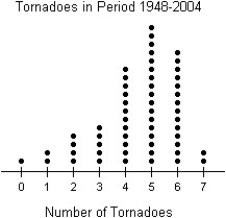
The data below give the number of tornadoes that happened each year in a certain county from 1948 through 2004.Create a dotplot of these data.
2 6 2 4 5 1
4 5 6 4 3 5
6 6 4 5 5 4
0 4 5 6 6 5
7 5 5 3 7 2
3 2 5 6 6 6
6 6 4 5 4 5
4 5 6 6 5 4
5 6 5 4 5 4
3 3 1
Dotplot
A statistical chart consisting of data points plotted on a simple scale, used to visualize the distribution of a data set.
Tornadoes
Violently rotating columns of air that are in contact with both the surface of the Earth and a cumulonimbus cloud or, in rare cases, the base of a cumulus cloud.
- Formulate and interpret stem-and-leaf representations for multiple data assemblies.

Verified Answer
OZ

Learning Objectives
- Formulate and interpret stem-and-leaf representations for multiple data assemblies.
Related questions
The Weights,in Kilograms,of the Members of the Varsity Football Team ...
The Diastolic Blood Pressures,in Mm Hg,for a Sample of Patients ...
The Data Below Represent the Midterm Grades for 24 Students ...
Students Were Asked to Make a Histogram of the Number \[\begin{array} ...
The Mathematics Department at a Canadian University Collected Data for ...