Asked by rebecca geissler on Jun 17, 2024

Verified
Students in a Political Science course were asked to describe their politics as "Liberal","Moderate",or "Conservative." Here are the results: Sex Politics Liberal Moderate Conservative Total Female 454912106 Male 645325142 Total 10910237248\begin{array}{l}Sex\begin{array}{l}\begin{array} { | l | c c c | c | } &&\text { Politics }\\\\\hline & \text { Liberal } & \text { Moderate } & \text { Conservative } & \text { Total } \\\hline \text { Female } & 45 & 49 & 12 & 106 \\\text { Male } & 64 & 53 & 25 & 142 \\\hline \text { Total } & 109 & 102 & 37 & 248 \\\hline\end{array}\end{array}\end{array}Sex Female Male Total Liberal 4564109 Politics Moderate 4953102 Conservative 122537 Total 106142248 Which graphical display shows the marginal distribution of politics in the class?
I 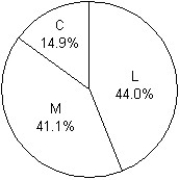
II 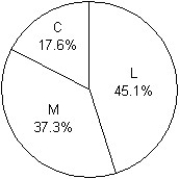
III 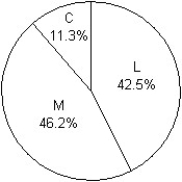
A) III
B) II
C) I
D) I,II,III
E) None of these displays show the marginal distribution of politics in the class.
Political Science
The study of politics, government systems, and political behavior.
Liberal
A political or social philosophy advocating for freedom of the individual, democratic principles, and governmental guarantees of individual rights and liberties.
Moderate
A level of intensity, degree, or amount that is considered reasonable, not too extreme or excessive.
- Understand the use of conditional and marginal distributions in analyzing categorical data.

Verified Answer
DD
DOMINIC DUKERJun 23, 2024
Final Answer :
C
Explanation :
The bar graph in option C shows the marginal distribution of politics in the class. The x-axis displays the three categories - Liberal, Moderate, and Conservative, and the y-axis displays the frequency or count of students in each category. Therefore, this graph represents the marginal distribution of politics in the class. Option A and Option B do not show the marginal distribution of politics and Option D includes all the graphs, which is not necessary as we only need one graph to display the marginal distribution.

Learning Objectives
- Understand the use of conditional and marginal distributions in analyzing categorical data.
Related questions
A Survey of University Students in Canada Reported the Following ...
{Number of Hamsters Narrative} Determine the Marginal Probability Distributions of ...
In a Questionnaire, Respondents Are Asked to Mark Their Marital ...
Categorical Data ...
The Two-Way Table Summarizes Data from the Human Resource Department ...