Asked by Genelyn Silva on May 11, 2024

Verified
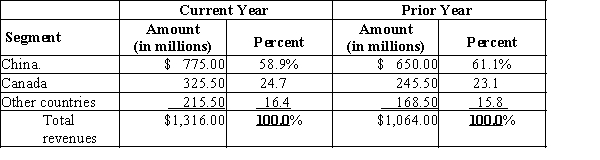
Payton Company has the following segment revenues for the two most recent fiscal years.?? Segment Current Y ear (in millions) Prior Y ear (in millions) China $775.00$650.00 Canada 325.50245.50 Other countries 215.50168.50 Total revenues $1,316.00‾$1,064.00‾\begin{array} { | l | r | r | } \hline \text { Segment } & \begin{array} { c } \text { Current Y ear } \\\text { (in millions) }\end{array} & \begin{array} { c } \text { Prior Y ear } \\\text { (in millions) }\end{array} \\\hline \text { China } & \$ 775.00 & \$ 650.00 \\\hline \text { Canada } & 325.50 & 245.50 \\\hline \text { Other countries } & 215.50 & 168.50 \\\hline \text { Total revenues } & \underline{\$ 1,316 .00} & \underline{ \$ 1,064.00 }\\\hline\end{array} Segment China Canada Other countries Total revenues Current Y ear (in millions) $775.00325.50215.50$1,316.00 Prior Y ear (in millions) $650.00245.50168.50$1,064.00 Prepare a vertical analysis of the segment data. Round to one decimal place.?
Vertical Analysis
A method of financial statement analysis in which each line item is listed as a percentage of a base figure within the statement.
Segment Data
Information regarding the different operating segments of a company as required by accounting standards to help investors better understand the company's performance.
Fiscal Years
A one-year period that companies and governments use for financial reporting and budgeting, which may not necessarily align with the calendar year.
- Carry out horizontal and vertical analysis on segment information or financial statements.

Verified Answer

Learning Objectives
- Carry out horizontal and vertical analysis on segment information or financial statements.
Related questions
Connie and Jill Operate Reardon's Bakery Which Has the Following ...
Maximilian Corporation Provided Revenue Disclosures for the Current Year by ...
Eastwood Publishing Reports the Following Segment Data Regarding Its Textbook ...
123 Kids TV Operates in Five Major International Segments Prepare ...
When Doing a Vertical Analysis, Which of the Following Is ...