Asked by Brian Henry on Jul 13, 2024

Verified
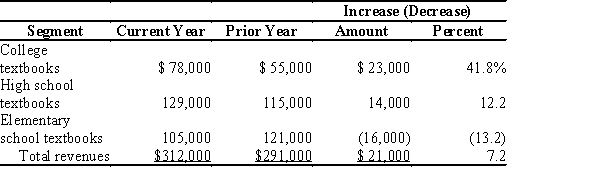
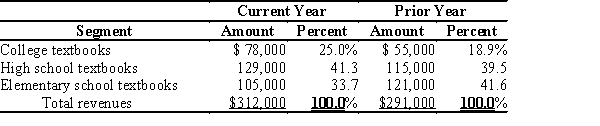
Eastwood Publishing reports the following segment data regarding its textbook sales:? Segment Current Year Prior Year College textbooks $78,000$55,000 High school textbooks 129,000115,000 Elementary school textbooks 105,000‾121,000‾ Total revenues $312,000‾‾$291,000‾‾\begin{array} { l r r } \hline \textbf { Segment } & \textbf { Current Year } & \textbf { Prior Year } \\\hline \text { College textbooks } & \$ 78,000 & \$ 55,000 \\\text { High school textbooks } & 129,000 & 115,000 \\\text { Elementary school textbooks } & \underline{ 105,000 }&\underline { 121,000 } \\\text { Total revenues } & \underline{\underline{ \$ 312,000 }} & \underline{\underline{\$ 291,000 }} \\\hline\end{array} Segment College textbooks High school textbooks Elementary school textbooks Total revenues Current Year $78,000129,000105,000$312,000 Prior Year $55,000115,000121,000$291,000 Perform a horizontal analysis and a vertical analysis for Eastwood Publishing. Round to one decimal place.
Horizontal Analysis
A technique in financial analysis where line items on financial statements are compared across subsequent periods to identify trends or significant changes.
Vertical Analysis
A method in financial analysis where each entry in a statement is listed as a proportion of another item, often used to compare line items over different periods.
Textbook Sales
The activity or business of selling educational books utilized primarily in schools and universities.
- Conduct horizontal and vertical analyses on segment data or financial statements.

Verified Answer

Learning Objectives
- Conduct horizontal and vertical analyses on segment data or financial statements.
Related questions
Connie and Jill Operate Reardon's Bakery Which Has the Following ...
Payton Company Has the Following Segment Revenues for the Two ...
123 Kids TV Operates in Five Major International Segments Prepare ...
Maximilian Corporation Provided Revenue Disclosures for the Current Year by ...
In a Comparative Balance Sheet, the Accounts Payable Balance for ...