Asked by Lovepreet Singh on Apr 24, 2024
Owners of a new computer store tracked sales (in thousands)for the first 12 days,and displayed the data in a scatterplot.Make a histogram of the daily sales since the shop has been in business. 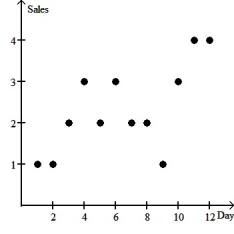
Scatterplot
A type of graph in statistics used to display values for two variables for a set of data, showing the relation between them.
Histogram
A graphical representation of the distribution of numerical data, where the data is grouped into ranges and represented as bars.
Daily Sales
The total revenue generated from sales of goods or services in a single business day.
- Build proficiency in converting data from scatterplots to histograms to observe the distribution patterns of a singular variable.

Learning Objectives
- Build proficiency in converting data from scatterplots to histograms to observe the distribution patterns of a singular variable.
Related questions
The Following Table Gives the Total Sales (Revenue)and Profits for ...
Owners of a New Appliances Store Tracked Sales (In Thousands)for ...
The Owner of a Small Manufacturing Plant Employs Nine People ...
A Graphical Depiction of a Frequency Distribution for Numerical Data ...
In June, Karen Henderson, an Accountant, Examined Her Records to ...