Asked by Justin Paquet on May 17, 2024

Verified
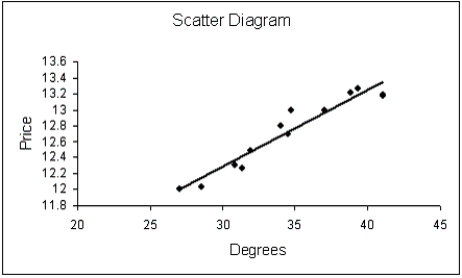
{Oil Quality and Price Narrative} Plot the least squares regression line on the scatter diagram.
API Gravity
A measure of how heavy or light a petroleum liquid is compared to water, used in the oil industry to classify oils.
Price Per Barrel
The cost for a barrel of commodities such as oil or beer, typically used to measure large quantities.
Least Squares Regression
A statistical method used to determine the best-fitting line through a set of data points by minimizing the sum of the squares of the vertical distances of the points from the line.
- Calculate approximations through the utilization of regression models and evaluate the dependability of these approximations.
- Understand the meaning of regression coefficients, such as slopes and intercepts.

Verified Answer

Learning Objectives
- Calculate approximations through the utilization of regression models and evaluate the dependability of these approximations.
- Understand the meaning of regression coefficients, such as slopes and intercepts.
Related questions
{Allman Brothers Concert Narrative} Interpret the Value of the Slope ...
In Reference to the Equation ,The Value −0 ...
One of the Important Factors Determining a Car's Fuel Efficiency ...
The Relationship Between Two Quantities X and Y Is Examined ...
Ten Ford Escort Classified Ads Were Selected A) \(\hat{\text { price ...