Asked by Marish Quilicot on Apr 24, 2024
One of the important factors determining a car's fuel efficiency is its weight.This relationship is examined for 11 cars,and the association is shown in the scatterplot below. 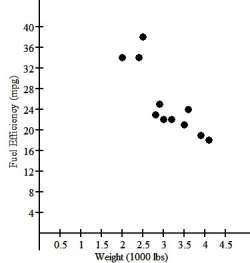 If a linear model is considered,the regression analysis is as follows: Dependent variable: MPG
R-squared = 84.7%
VARIABLE COEFFICIENT
Intercept 47.1181
Weight -7.34614
What does the slope say about this relationship?
A) Gas mileage increases an average of 7.346 mpg for each thousand pounds of weight.
B) Gas mileage decreases an average of 7.346 mpg for each thousand pounds of weight.
C) Gas mileage increases an average of 4.712 mpg for each thousand pounds of weight.
D) Gas mileage decreases an average of 4.712 mpg for each thousand pounds of weight.
E) Gas mileage decreases an average of .7346 mpg for each thousand pounds of weight.
Fuel Efficiency
A measure of how effectively a vehicle uses fuel, often expressed in miles per gallon (mpg) or liters per 100 kilometers (l/100km).
Scatterplot
A type of graph used in statistics to display values for typically two variables for a set of data, showing the relationship between them.
Gas Mileage
A measure of a vehicle's fuel efficiency, typically represented as miles per gallon (MPG).
- Clarify the significance of the slope and intercept in forming a regression line, in reference to the associated data.
- Evaluate and interpret the value of the coefficient of determination (R^2).

Learning Objectives
- Clarify the significance of the slope and intercept in forming a regression line, in reference to the associated data.
- Evaluate and interpret the value of the coefficient of determination (R^2).
Related questions
Ten Ford Escort Classified Ads Were Selected A) \(\hat{\text { price ...
A Random Sample of Records of Electricity Usage of Homes ...
A Random Sample of 150 Yachts Sold in the Canada ...
The Relationship Between Two Quantities X and Y Is Examined ...
In a Simple Linear Regression Problem, the Following Statistics Are ...