Asked by Latyrus Edwards on Jun 07, 2024

Verified
McDaniel Shipyards wants to develop control charts to assess the quality of its steel plate. They take ten sheets of 1" steel plate and compute the number of cosmetic flaws on each roll. Each sheet is 20' by 100'. Based on the following data, develop limits for the control chart, plot the control chart, and determine whether the process is in control.
Sheet Number of flaws 112132405165708290102\begin{array} { | c | c | } \hline \text { Sheet } & \begin{array} { c } \text { Number of } \\\text { flaws }\end{array} \\\hline 1 & 1 \\\hline 2 & 1 \\\hline 3 & 2 \\\hline 4 & 0 \\\hline 5 & 1 \\\hline 6 & 5 \\\hline 7 & 0 \\\hline 8 & 2 \\\hline 9 & 0 \\\hline 10 & 2 \\\hline\end{array} Sheet 12345678910 Number of flaws 1120150202
Steel Plate
A flat sheet of steel that can vary in thickness and is used in a variety of applications, from construction to manufacturing.
Cosmetic Flaws
Minor imperfections in the appearance of a product that do not affect its functionality.
Control Chart Limits
Thresholds defined in control charts that represent acceptable variations in a process, used to detect if a process is out of control.
- Familiarize oneself with the essential elements of statistical process control (SPC) and its relevance in overseeing quality standards.
- Navigate the assessment and interpretation of control limits and process capabilities among various control chart forms such as X-bar, R-chart, p-chart, and c-chart.
- Examine sample datasets to understand whether a process falls within statistical control parameters.

Verified Answer
RK
Rajiv KumarJun 12, 2024
Final Answer :
Total units sampled 10 Total defects 14 Defect rate, c-bar 1.4 Standard deviation 1.183216 z value 3 Upper Control Limit 4.949648 Center Line 1.4 Lower Control Limit 0\begin{array} { | l | r | } \hline \text { Total units sampled } & 10 \\\hline \text { Total defects } & 14 \\\hline \text { Defect rate, c-bar } & 1.4 \\\hline \text { Standard deviation } & 1.183216 \\\hline \text { z value } & 3 \\\hline & \\\hline \text { Upper Control Limit } & 4.949648 \\\hline \text { Center Line } & 1.4 \\\hline \text { Lower Control Limit } & 0 \\\hline\end{array} Total units sampled Total defects Defect rate, c-bar Standard deviation z value Upper Control Limit Center Line Lower Control Limit 10141.41.18321634.9496481.40 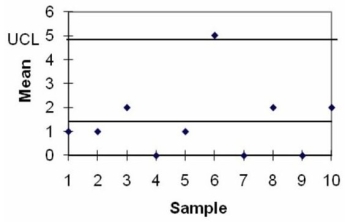 Sample six is above the control limits; therefore, the process is out of control.
Sample six is above the control limits; therefore, the process is out of control. 
Learning Objectives
- Familiarize oneself with the essential elements of statistical process control (SPC) and its relevance in overseeing quality standards.
- Navigate the assessment and interpretation of control limits and process capabilities among various control chart forms such as X-bar, R-chart, p-chart, and c-chart.
- Examine sample datasets to understand whether a process falls within statistical control parameters.