Asked by Deijah Drakeford on May 06, 2024

Verified
Cartons of Plaster of Paris are supposed to weigh exactly 32 oz. Inspectors want to develop process control charts. They take ten samples of six boxes each and weigh them. Based on the following data, compute the lower and upper control limits and determine whether the process is in control.
Sample Mean Range 133.81.1234.60.3334.70.4434.10.7534.20.3634.30.4733.90.5834.10.8934.20.41034.40.3\begin{array} { | c | c | c | } \hline \text { Sample } & \text { Mean } & \text { Range } \\\hline 1 & 33.8 & 1.1 \\\hline 2 & 34.6 & 0.3 \\\hline 3 & 34.7 & 0.4 \\\hline 4 & 34.1 & 0.7 \\\hline 5 & 34.2 & 0.3 \\\hline 6 & 34.3 & 0.4 \\\hline 7 & 33.9 & 0.5 \\\hline 8 & 34.1 & 0.8 \\\hline 9 & 34.2 & 0.4 \\\hline 10 & 34.4 & 0.3 \\\hline\end{array} Sample 12345678910 Mean 33.834.634.734.134.234.333.934.134.234.4 Range 1.10.30.40.70.30.40.50.80.40.3
Control Charts
Statistical tools used in quality control to monitor, control, and improve the process performance over time by plotting data points in time order.
Lower Control Limit
A statistical measure used in process control, representing the lowest acceptable boundary of process variation for quality assurance.
Upper Control Limit
In quality control, it represents the highest value on a control chart that a process variable can reach before it is considered to signal potential loss of control, necessitating investigation.
- Engage in computation and elucidation of the control limits and process capabilities present in different control chart forms, including X-bar, R-chart, p-chart, and c-chart.
- Analyze example data to determine the stability of a process through statistical means.

Verified Answer
LM
Leigh MemunatuMay 10, 2024
Final Answer :
n = 6; overall mean = 34.23; Rˉ\bar { R }Rˉ = 0.52.
Upper control limit 34.481161.04208 Center line 34.230.52 Lower control limit 33.978840\begin{array} { | l | r | r| } \hline \text { Upper control limit } & 34.48116 & 1.04208 \\\hline \text { Center line } & 34.23 & 0.52 \\\hline \text { Lower control limit } & 33.97884 & 0 \\\hline\end{array} Upper control limit Center line Lower control limit 34.4811634.2333.978841.042080.520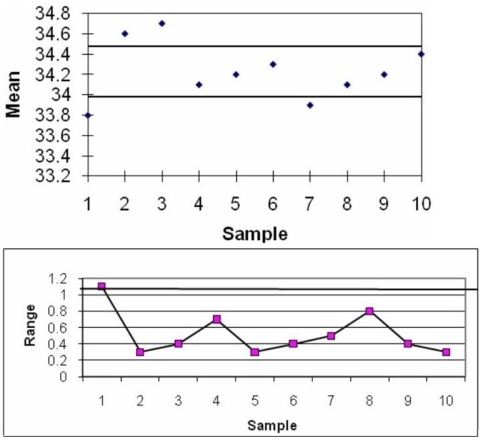 The mean values for samples 1, 2, 3, and 7 fall outside the control limits on the x-bar chart and sample 1 falls outside the upper limit on the R-chart. Therefore, the process is out of control.
Upper control limit 34.481161.04208 Center line 34.230.52 Lower control limit 33.978840\begin{array} { | l | r | r| } \hline \text { Upper control limit } & 34.48116 & 1.04208 \\\hline \text { Center line } & 34.23 & 0.52 \\\hline \text { Lower control limit } & 33.97884 & 0 \\\hline\end{array} Upper control limit Center line Lower control limit 34.4811634.2333.978841.042080.520
The mean values for samples 1, 2, 3, and 7 fall outside the control limits on the x-bar chart and sample 1 falls outside the upper limit on the R-chart. Therefore, the process is out of control. 
Learning Objectives
- Engage in computation and elucidation of the control limits and process capabilities present in different control chart forms, including X-bar, R-chart, p-chart, and c-chart.
- Analyze example data to determine the stability of a process through statistical means.