Asked by Zaylah Harris on Jul 02, 2024
Last year, David Lum opened a new pharmacy. He already had one store located near the city hospital. When a new outpatient surgery clinic began operation, he opened his second pharmacy nearby. In June of this year, Lum wanted a business loan. The bank asked him to report the monthly revenues of each store for the first five months of the year. Lum displayed the data as follows.
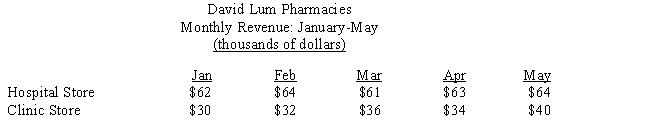
a.Bar graph
a.Use Figure 24-7a to construct a bar graph to illustrate the monthly revenues of the clinic store. Label where necessary.b
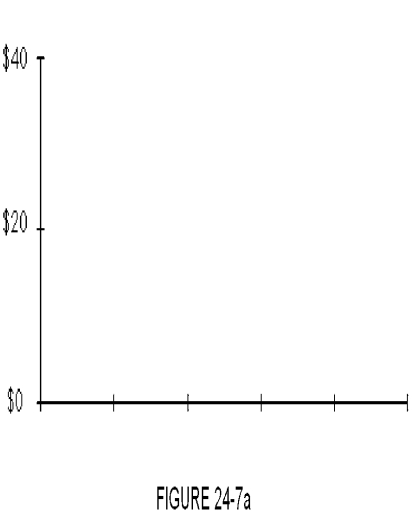
Use Figure 24-7b to construct a line graph to illustrate the monthly revenues of the clinic store. Label where necessary.
b.Line graph
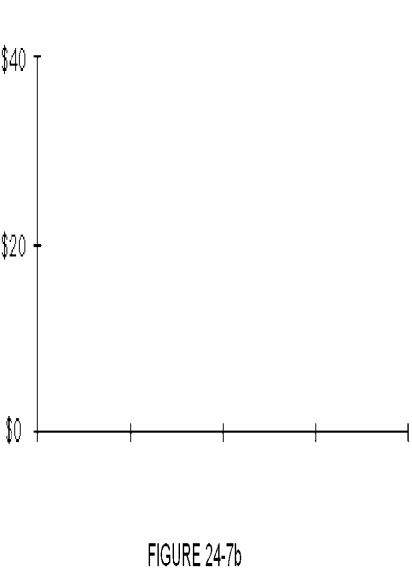
c.Comparative bar graph
c.Use Figure 24-7c to construct a comparative bar graph to illustrate the monthly revenues of both pharmacies. Label where necessary. Shade the bars for each store differently.
Monthly Revenues
The total income generated by a business or entity from its activities within a month.
Bar Graph
Also known as a bar chart, a graphic presentation of statistical information resembling the histogram except that there may not be a numeric scale on the horizontal axis and the bars normally do not touch each other.
Line Graph
A type of graph often used for illustrating data over time.
- Generate and interpret bar graphs for individual and comparative data analysis.
- Construct and interpret line graphs for trend analysis over time.
- Develop and analyze comparative bar graphs for parallel comparison of different data sets.

Learning Objectives
- Generate and interpret bar graphs for individual and comparative data analysis.
- Construct and interpret line graphs for trend analysis over time.
- Develop and analyze comparative bar graphs for parallel comparison of different data sets.
Related questions
The Table Below Displays the Quarterly Revenue of Wallace Printing ...
The Table Below Displays the Quarterly Revenues of Wallace Printing ...
Which of the Following Varieties of Bar Graphs Show the ...
The Average Price for Different Brands of Toothpaste Could Be ...
The Bar Graph Below Represents the Highest Education Level Achieved ...