Asked by Alicia Ebding on Jun 14, 2024

Verified
In the local cotton market, there are 1,000 producers that have identical short-run cost functions. They are: 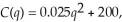 where q is the number of bales produced each period. The short-run marginal cost function for each producer is: MC(q) = 0.05q. If the local cotton market is perfectly competitive, what is each cotton producer's short-run supply curve? Derive the local market supply curve of cotton.
Short-Run Supply Curve
A graphical representation showing the quantity of a good that producers are willing and able to supply at different prices in the short term, holding some factors constant.
Market Supply Curve
Represents the total quantity of a good that sellers are willing to sell across all price points in a given market.
Cotton Producer
An entity or individual engaged in the cultivation and production of cotton.
- Understand the interplay among marginal cost, average variable cost, fixed costs, and its repercussions for short-run supply curves.
- Analyze the effects of external factors such as taxes on supply and market dynamics.

Verified Answer
DJ
Dylan JosephJun 20, 2024
Final Answer :
Given the cotton market is competitive, the firms will set their marginal cost to the market price (i.e., they are price takers). The quantity supplied by each cotton producer can be found as follows: 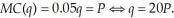 To determine the market supply, we add the quantity supplied for all producers together at each price. Thus,
 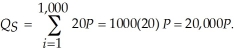 If we wanted to graph the supply with price on the vertical axis and quantity on the horizontal axis, we would solve the supply equation for price. This would be:
To determine the market supply, we add the quantity supplied for all producers together at each price. Thus, If we wanted to graph the supply with price on the vertical axis and quantity on the horizontal axis, we would solve the supply equation for price. This would be: 
Learning Objectives
- Understand the interplay among marginal cost, average variable cost, fixed costs, and its repercussions for short-run supply curves.
- Analyze the effects of external factors such as taxes on supply and market dynamics.