Asked by Glenda Gonzalez on Apr 29, 2024

Verified
Ten samples of size four were taken from a process, and their weights measured. The sample averages and sample ranges are in the following table. Construct and plot an x-bar and R-chart using this data. Is the process in control?
Sample Mean Range 120.010.45219.980.67320.250.30419.900.30520.350.36619.230.49720.010.53819.980.40920.560.951019.970.79\begin{array} { |l | l | l | } \hline \text { Sample } & \text { Mean } & \text { Range } \\\hline 1 & 20.01 & 0.45 \\\hline 2 & 19.98 & 0.67 \\\hline 3 & 20.25 & 0.30 \\\hline 4 & 19.90 & 0.30 \\\hline 5 & 20.35 & 0.36 \\\hline 6 & 19.23 & 0.49 \\\hline 7 & 20.01 & 0.53 \\\hline 8 & 19.98 & 0.40 \\\hline 9 & 20.56 & 0.95 \\\hline 10 & 19.97 & 0.79 \\\hline\end{array} Sample 12345678910 Mean 20.0119.9820.2519.9020.3519.2320.0119.9820.5619.97 Range 0.450.670.300.300.360.490.530.400.950.79
Sample Averages
The mean of a set of data points taken from a larger population, used in statistics to estimate the characteristics of the whole population.
X-bar
A statistical term representing the average or mean value of a set of data, commonly used in quality control processes.
R-chart
A tool in statistical process control that displays the variation among different samples to assess the stability of processes.
- Comprehend the basic principles of statistical process control (SPC) and its significance in maintaining quality.
- Execute the analysis and explanation of control limits and process capabilities throughout various control chart types, like X-bar, R-chart, p-chart, and c-chart.
- Inspect sample data to verify if a process is held within statistical constraints.

Verified Answer
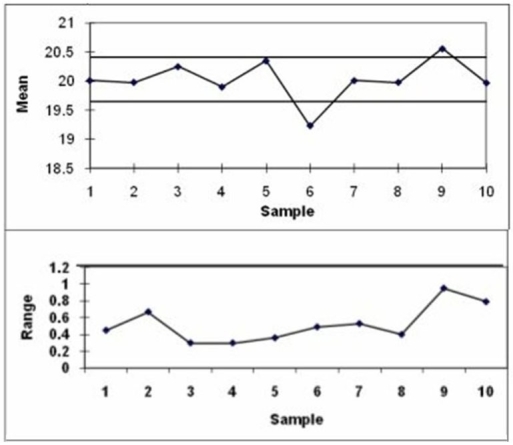 The x-bar chart is out of control because samples 6 and 9 are outside of the control limit, and therefore the process is out of control.
Learning Objectives
- Comprehend the basic principles of statistical process control (SPC) and its significance in maintaining quality.
- Execute the analysis and explanation of control limits and process capabilities throughout various control chart types, like X-bar, R-chart, p-chart, and c-chart.
- Inspect sample data to verify if a process is held within statistical constraints.
Related questions
A City Police Chief Decides to Do an Annual Review ...
Repeated Sampling of a Certain Process Shows the Average of ...
An Operator Trainee Is Attempting to Monitor a Filling Process ...
The Width of a Bronze Bar Is Intended to Be ...
A Bank's Manager Has Videotaped 20 Different Teller Transactions to ...