Asked by Abbie Mulbarger on May 31, 2024

Verified
A paired-difference experiment was conducted to compare two populations. The data are shown in the table. Use a sign test to determine whether the population distributions are different. 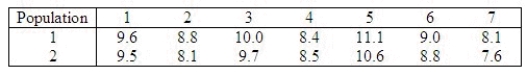 The null and alternate hypotheses are as follows:
  Determine an appropriate rejection region with
  0.01.
0.01.
Critical Values: ______________ Enter n1, n2
Calculate the observed value of the test statistic.
______________
Conclude: ______________
The data present ______________ evidence to indicate that populations 1 and 2 are different.
Paired-difference Experiment
An experimental design where the observations are made in pairs, and the analysis is based on the differences within each pair.
Rejection Region
The range of values for which the null hypothesis is not considered likely and is rejected in a statistical test.
- Learn the process and interpretation of the sign test for comparing two related samples.
- Recognize the conditions and assumptions underlying different types of significance tests, including paired differences experiments.

Verified Answer
AG

Learning Objectives
- Learn the process and interpretation of the sign test for comparing two related samples.
- Recognize the conditions and assumptions underlying different types of significance tests, including paired differences experiments.
Related questions
A Dog Kennel Manager Was Interested in Determining Whether There ...
Twenty Students Are Given an Attitude Test Before and After ...
A Car Dealer Was Interested in Comparing Two Brands of ...
The Principal of a High School Randomly Selected 30 Students ...
A Quality Control Manager at a Bottling Plant Wishes to ...