Asked by Arshana Arumansan on Jun 07, 2024

Verified
Which of the following statements about the analysis of two-way tables is/are TRUE?
A) Under the null hypothesis,the expected cell count is = 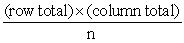 .
.
B) In a table with r rows and c columns,the number of degrees of freedom is (r - 1) (c - 1) .
C) A possible null hypothesis is that there is no association between the row and column variables.
D) All of the above are true.
E) Only A and B are true.
Two-Way Tables
Two-way tables categorize data into two dimensions, helping to analyze the relationship between two categorical variables.
Null Hypothesis
A default statement that there is no effect or no difference, used as a starting point for statistical hypothesis testing.
Degrees of Freedom
The number of independent values or quantities which can be assigned to a statistical distribution.
- Get to know the methods involved in analyzing two-way tables and where they are applied.
- Absorb the introductory concepts of chi-square distribution and its inherent properties.

Verified Answer

Learning Objectives
- Get to know the methods involved in analyzing two-way tables and where they are applied.
- Absorb the introductory concepts of chi-square distribution and its inherent properties.
Related questions
Are Avid Readers More Likely to Wear Glasses Than Those ...
The 5 th Percentile of a Chi-Squared Distribution with 10 Degrees ...
The Chi-Square Distribution Can Be Used in Constructing Confidence Intervals ...
The Chi-Squared Critical Value Denotes the Number on the ...
The Formula for Calculating Chi-Square Includes ______ ...