Asked by Konnie Sanchez on Jun 03, 2024

Verified
Using the scale below, draw the 1H NMR spectrum for isobutyl acetate, shown below. Present the peaks with correct splitting patterns and at the approximate chemical shift (+/- 0.5 ppm). Just above each peak, indicate the relative integration value of each type of hydrogen. 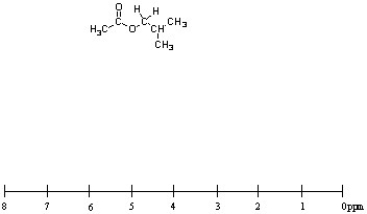
NMR Spectrum
A representation of the nuclear magnetic resonance absorption by nuclei in a sample.
Isobutyl Acetate
An organic compound and ester formed from the reaction of isobutanol with acetic acid, commonly used as a solvent and in flavorings.
Splitting Patterns
Describes how the peaks in an NMR spectrum are divided into multiple sub-peaks due to interactions between non-equivalent hydrogen atoms in a molecule, revealing its structure.
- Delve into the art of interpreting proton NMR (S1U1P11S1S1P0H) spectral findings to unravel the structure of organic compounds.
- Exhibit proficiency in sketching NMR spectra corresponding to specified organic molecules.

Verified Answer

Learning Objectives
- Delve into the art of interpreting proton NMR (S1U1P11S1S1P0H) spectral findings to unravel the structure of organic compounds.
- Exhibit proficiency in sketching NMR spectra corresponding to specified organic molecules.
Related questions
Deduce the Identity of the Following Compound from the 1 H ...
Deduce the Identity of the Following Compound from the Spectral ...
Deduce the Identity of the Following Compound from the 1 H ...
Deduce the Identity of the Following Compound from the 1 H ...
Deduce the Identity of the Following Compound from the 1 H ...