Asked by abdullah Mohammed on May 05, 2024

Verified
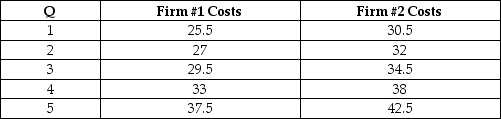
The table below provides cost information for two firms in a competitive industry. Graph the supply curves of the firms individually and jointly. For these two firms, at any positive output level, marginal cost exceeds average variable cost.
Supply Curves
Graphical representations showing the relationship between the price of a good and the amount of it that producers are willing to supply at that price.
Average Variable Cost
The total variable costs of production divided by the quantity of output produced, indicating the cost to produce an additional unit when fixed costs are excluded.
- Acquire an understanding of the interrelation among marginal cost, average variable cost, fixed costs, and its impact on short-run supply curves.

Verified Answer
ZK
Zybrea KnightMay 06, 2024
Final Answer : 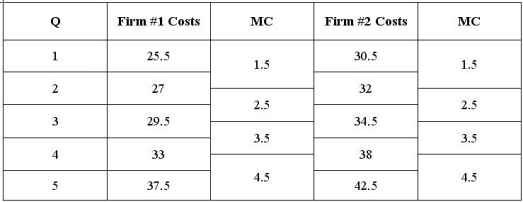 Since we know the industry is competitive and that the average variable cost is always exceeded by the marginal cost, the firm will be willing to supply the amount of output that sets the market price equal to the marginal cost in the short run. This implies we may graph Firm #1 (S1) and Firm #2 (S2) supply curves as indicated in the diagram below. To determine the joint supply (SJ) of these two firms, we add their individual supplies together for each price. The joint supply is indicated below.
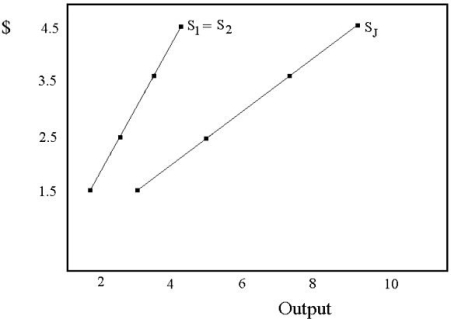
Since we know the industry is competitive and that the average variable cost is always exceeded by the marginal cost, the firm will be willing to supply the amount of output that sets the market price equal to the marginal cost in the short run. This implies we may graph Firm #1 (S1) and Firm #2 (S2) supply curves as indicated in the diagram below. To determine the joint supply (SJ) of these two firms, we add their individual supplies together for each price. The joint supply is indicated below. 
Learning Objectives
- Acquire an understanding of the interrelation among marginal cost, average variable cost, fixed costs, and its impact on short-run supply curves.