Asked by Vince Carrola on May 10, 2024

Verified
The scatterplot below displays data collected from 20 adults on their age and overall GPA at graduation. 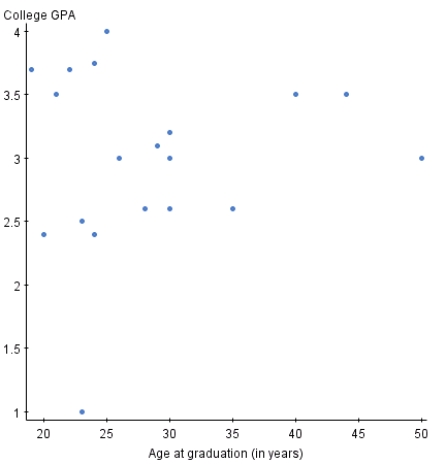
The scatterplot shows a strong relationship.
Scatterplot
A graphical representation in which two variables are plotted along two axes, revealing any correlation or pattern between them.
GPA
Grade Point Average, a cumulative average of a student's grades, typically on a 4.0 scale.
- Discern and ascertain the relationship inherent between two quantitative variables.

Verified Answer
KL
Kelsey LamerMay 13, 2024
Final Answer :
False
Explanation :
We cannot determine whether the scatterplot shows a strong relationship without knowing the correlation coefficient or calculating the strength of the relationship.

Learning Objectives
- Discern and ascertain the relationship inherent between two quantitative variables.
Related questions
The Scatterplot Below Displays Data Collected from 20 Adults on ...
Correlational Research Is Most Useful for Purposes of ...
The Scatterplot Is a Graph That Is Used to Graphically ...
If the Linear Relationship Between the Dependent and Independent Variables ...
In Constructing a Scatterplot, It Would Not Be Appropriate To ...