Asked by Louis Padilla on Jul 25, 2024

Verified
The market for all-leather men's shoes is served by both domestic (U.S.) and foreign (F) producers. The domestic producers have been complaining that foreign producers are dumping shoes onto the U.S. market. As a result, Congress is very close to enacting a policy that would completely prohibit sales by foreign manufacturers of leather shoes in the U.S. market. The demand curve and relevant supply curves for the leather shoe market are as follows:
QD = 50,000 - 500P
QUS = 6000 + 150P
QF = 2000 + 50P,
where Q = thousands of pairs of shoes per year, and P = price per pair.
a. Currently there are no restrictions covering all-leather men's shoes. What are the current equilibrium values?
b. Calculate the price and quantity that would prevail if the proposed policy is enacted.
c. Sketch a diagram that analyzes the economic welfare implications of the proposed policy.
Foreign Producers
Companies or individuals that manufacture goods or provide services in one country for consumption in another.
Leather Shoes
are footwear made from the hide of animals, known for their durability, flexibility, and aesthetic appeal.
Dumping
The act of exporting a product at a price lower than the price it is sold at within the exporting country.
- Determine and explain the equilibrium price and quantity in free markets as well as in scenarios with government intervention.
- Analyze the effects on welfare due to trade barriers and state interference in the marketplace.
- Analyze the impact of international trade policies on domestic markets.

Verified Answer
DH
Deidra HolmanJul 29, 2024
Final Answer :
a.Without restrictions, the supply curve is the sum of U.S. and foreign supply curves:
QS = QUS + QF
QS = 8000 + 200P
Equate QS and QD:
50,000 - 500P = 8000 + 200P
42000 = 700P
P = 60
QD = 50,000 - 500(60)
Q = 20,000
b.Under the proposed policy, QUS is relevant supply curve.Equate QD and QUS:
50,000 - 500P = 6000 +150P
44,000 = 650P
P = 67.69
Price rises to 67.69.
QD = 50,000 - 500(67.69)
QD = 16.155; Quantity falls to 16,155.
c.Sketch diagram using demand and U.S. supply curve.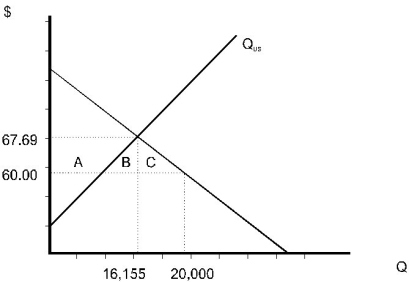 Loss in consumer surplus is A + B + c.Gain in producer surplus is a.It is clear that there is a deadweight loss, even if we assign no value to the producer surplus of foreign manufacturers.
QS = QUS + QF
QS = 8000 + 200P
Equate QS and QD:
50,000 - 500P = 8000 + 200P
42000 = 700P
P = 60
QD = 50,000 - 500(60)
Q = 20,000
b.Under the proposed policy, QUS is relevant supply curve.Equate QD and QUS:
50,000 - 500P = 6000 +150P
44,000 = 650P
P = 67.69
Price rises to 67.69.
QD = 50,000 - 500(67.69)
QD = 16.155; Quantity falls to 16,155.
c.Sketch diagram using demand and U.S. supply curve.
Loss in consumer surplus is A + B + c.Gain in producer surplus is a.It is clear that there is a deadweight loss, even if we assign no value to the producer surplus of foreign manufacturers.
Learning Objectives
- Determine and explain the equilibrium price and quantity in free markets as well as in scenarios with government intervention.
- Analyze the effects on welfare due to trade barriers and state interference in the marketplace.
- Analyze the impact of international trade policies on domestic markets.
Related questions
The Supply and Demand Curves for Corn Are as Follows ...
In General, the Deadweight Loss Associated with an Import Tariff ...
The Nation of Spritzland Used to Prohibit International Trade, but ...
The Demand and Supply Functions for Pizza in the Local ...
The Market Demand and Supply Functions for Pork Are ...