Asked by Subamalar Muniandy on Apr 28, 2024

Verified
The following n = 10 observations are a sample from a normal population: 10.4 10.1 9.5 10.5 10.6 9.3 9.9 10.7 9.5 10.0 Find the mean and standard deviation of these data. Find a 99% confidence interval for the population mean  . Test
 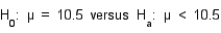 . Use
. Use  = 0.01 Do the results of part (b) support your conclusion in part (c).
Mean = ______________
Standard Deviation = ______________
Test Statistic = ______________
Conclusion: ______________
What is 99% confidence interval? (CI)
CI = ______________ Enter (n1, n2)
Normal Population
A population that follows a normal distribution, characterized by a bell-shaped curve.
Confidence Interval
A spectrum of values obtained from sampled data that is probable to encompass the value of a yet-to-be-determined population parameter.
Standard Deviation
A measure that quantifies the amount of variation or dispersion of a set of data values.
- Create and interpret intervals of confidence for means within a population.
- Understand the concept of sampling distribution and its importance in hypothesis testing.
- Elucidate the significance of statistical test outcomes in their related environment.

Verified Answer
ME

Learning Objectives
- Create and interpret intervals of confidence for means within a population.
- Understand the concept of sampling distribution and its importance in hypothesis testing.
- Elucidate the significance of statistical test outcomes in their related environment.
Related questions
Here Are the Red Blood Cell Counts (In 106 Cells ...
During a Water Shortage, a Water Company Randomly Sampled Residential ...
The Following Data Were Drawn from a Normal Population: 15 ...
The Average Gas Mileage of a 4-Wheel Drive Truck Is ...
A Drapery Store Manager Was Interested in Determining Whether a ...