Asked by Chris Miller on May 01, 2024

Verified
The following is the regression output for a regression of calories on fiber and sugars for 10 popular types of cereal.Fill in the missing information,indicated by the boldface lettersa to f (up to three decimal places).
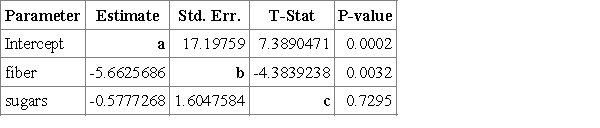 Analysis of variance table for multiple regression model:
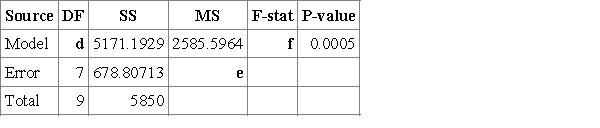
Multiple Regression Model
A statistical technique that models the relationship between a single dependent variable and two or more independent variables, allowing for predictions of the dependent from the independents.
Analysis Of Variance
A statistical method used to compare the means of three or more samples to understand if at least one of the sample means is significantly different from the others.
Regression Output
The results of a regression analysis, typically including estimates of the intercept, slope coefficients, standard errors, and measures of model fit such as R-squared.
- Interpret regression analysis output, including the analysis of variance table.

Verified Answer
ZK

Learning Objectives
- Interpret regression analysis output, including the analysis of variance table.