Asked by Zachariah Andress on May 26, 2024

Verified
The figure below shows the aggregate demand and supply curves for the U.S.A rightward shift of the aggregate supply curve from AS to AS' would be caused by:
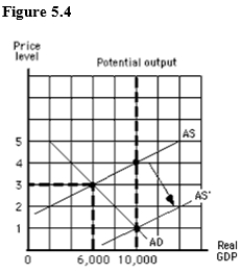
A) an increase in resource prices,improved technology,or an extension of patent protection.
B) a decrease in resource prices,improved technology,or an extension of patent protection.
C) a decrease in resource prices,improved technology,or a shortening of patent protection.
D) an appreciation of the dollar,higher inflation in Europe,or a decrease in resource prices.
E) a depreciation of the dollar,higher inflation in Asia,or improved technology.
Aggregate Supply Curve
A graphical representation showing the relationship between the overall price level in an economy and the quantity of goods and services produced.
Resource Prices
The cost of inputs used in the production of goods and services, such as raw materials, labor, and capital.
Patent Protection
Legal rights granted to inventors to exclusively make, use, or sell their inventions for a certain period.
- Comprehend the association between aggregate demand and aggregate supply and its influence on economic equilibrium.
- Ascertain the variables responsible for movements in aggregate demand and aggregate supply curves.

Verified Answer
LB
lelandra borgesMay 29, 2024
Final Answer :
B
Explanation :
A rightward shift of the aggregate supply curve indicates an increase in the quantity of goods and services supplied at each price level. This could be caused by factors such as a decrease in resource prices, improved technology, or an extension of patent protection. Therefore, the best choice is B, which includes all three of these possible causes for the shift.

Learning Objectives
- Comprehend the association between aggregate demand and aggregate supply and its influence on economic equilibrium.
- Ascertain the variables responsible for movements in aggregate demand and aggregate supply curves.