Asked by Chris Hughes on Jun 22, 2024

Verified
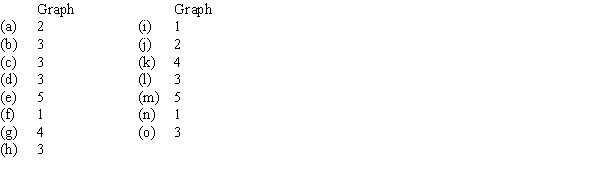
The cost graphs below show various types of cost behaviors.For each of the following costs, identify the cost graph that best describes its cost behavior as the number of units produced and sold increases: 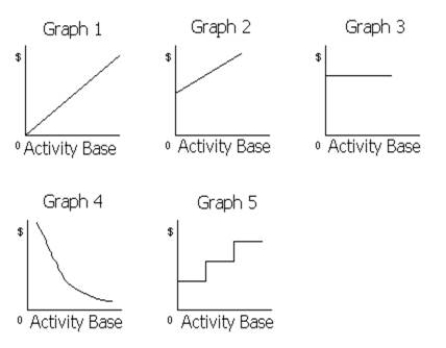 (a)Sales commissions of $6,000 plus $0.05 for each item sold
(b)Rent on warehouse of $12,000 per month
(c)Insurance costs of $2,500 per month
(d)Per-unit cost of direct labor
(e)Total salaries of quality control supervisors
(One supervisor must be added for each additional work shift.)
(f)Total employer pension costs of $0.35 per direct labor hour
(g)Per-unit straight-line depreciation costs
(h)Per-unit cost of direct materials
(i)Total direct materials cost
(j)Electricity costs of $5,000 per month plus $0.0004 per kilowatt-hour
(k)Per-unit cost of plant superintendent's salary
(l)Salary of the night-time security guard of $3,800 per month
(m)Repairs and maintenance costs of $3,000 for each 2,000 hours of factory machine usage
(n)Total direct labor cost
(o)Straight-line depreciation on factory equipment
Cost Graphs
A visual representation used in economics and accounting to display the relationship between costs and various levels of activity.
Direct Labor
The labor costs associated with employees who directly contribute to the production of goods or the provision of services.
Straight-line Depreciation
A method of allocating an asset’s cost evenly across its useful life.
- Recognize and evaluate the variable, fixed, and mixed expenditures.
- Interpret various types of cost behavior and its implications on cost-volume-profit analysis.

Verified Answer
RM

Learning Objectives
- Recognize and evaluate the variable, fixed, and mixed expenditures.
- Interpret various types of cost behavior and its implications on cost-volume-profit analysis.
Related questions
What Would Be the Average Fixed Cost Per Unit at ...
Dizzy Employees a Certified Operator for Each of Its 35 ...
For Liability Insurance, Dizzy Pays a Set Monthly Fee Plus ...
Variable Costs Are Costs That Remain Constant in Total Dollar ...
A Mixed Cost Has Characteristics of Both Variable and Fixed ...