Asked by Brianna Malonson on Mar 10, 2024

Verified
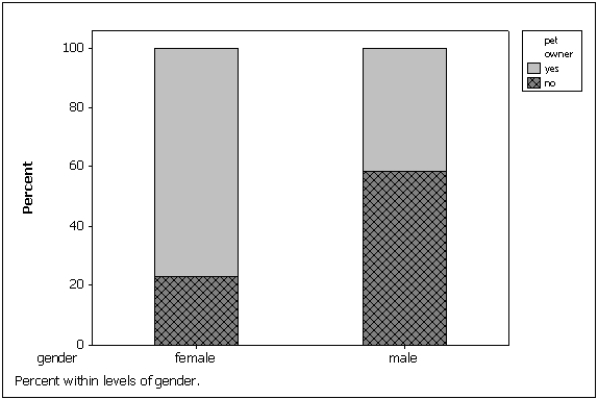
The bar charts below summarize data collected on 100 adults regarding gender and pet ownership.Which of the following statements is (are) true based on this chart? 
A) Gender and pet ownership are related; a higher percentage of males own pets than females.
B) Gender and pet ownership are related; a higher percentage of females own pets than males.
C) Gender and pet ownership are related; males and females own the same percentage of pets.
D) Gender and pet ownership are not related.
Pet Ownership
Having ownership or the responsibility of caring for pets, which are domesticated animals kept for companionship or pleasure.
- Learn the concept and operational application of cross-classification tables for evaluating connections between two nominal variables.
- Examine the nexus between gender and diverse factors employing cross-classification tables and visual graphics.

Verified Answer
KD
Katelyn Danielle
Mar 10, 2024
Final Answer :
B
Explanation :
The chart shows that the percentage of females who own pets is 57%, while the percentage of males who own pets is 43%. Therefore, it is true that a higher percentage of females own pets than males. This indicates that gender and pet ownership are related.

Learning Objectives
- Learn the concept and operational application of cross-classification tables for evaluating connections between two nominal variables.
- Examine the nexus between gender and diverse factors employing cross-classification tables and visual graphics.
Related questions
In the Following Cross-Classification Table,gender and Fantasy Baseball Participation Are ...
When Studying the Responses to Two Nominal Questions,we Should Develop ...
A Cross-Classification Table Is the Same Thing as Two Frequency ...
A Cross-Classification Table Summarizes Data from Two Nominal Variables
To Evaluate Two Nominal Variables at the Same Time,a(n)____________________ Table ...