Asked by Bijeta Pradhan on Jun 11, 2024

Verified
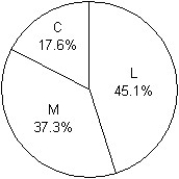
Students in a Political Science course were asked to describe their politics as "Liberal","Moderate",or "Conservative." Here are the results: Sex Politics Liberal Moderate Conservative Total Female 454912106 Male 645325142 Total 10910237248\begin{array}{l}Sex\begin{array}{l}\quad\quad\quad\quad\quad\quad\quad\quad\quad\quad\text { Politics }\\\begin{array} { | l | c c c | c | } \hline & \text { Liberal } & \text { Moderate } & \text { Conservative } & \text { Total } \\\hline \text { Female } & 45 & 49 & 12 & 106 \\\text { Male } & 64 & 53 & 25 & 142 \\\hline \text { Total } & 109 & 102 & 37 & 248 \\\hline\end{array}\end{array}\end{array}Sex Politics Female Male Total Liberal 4564109 Moderate 4953102 Conservative 122537 Total 106142248 Produce a pie chart that shows the conditional distribution of politics among the males.
Political Science
The academic discipline that studies governments, public policies, political processes, political behavior, and ideas about governance.
Liberal
In politics, a viewpoint or ideology favoring policies that emphasize individual freedoms, social justice, and the need for government intervention to achieve these goals.
Moderate
Neither extreme nor excessive, often referring to views, conditions, or amounts that are reasonable or average.
- Develop expertise in representing data through the crafting of bar and pie diagrams.

Verified Answer

Learning Objectives
- Develop expertise in representing data through the crafting of bar and pie diagrams.
Related questions
Statistics Canada Gives the Following Mortality Data for Canada in ...
The City of Windsor Department of Parks and Recreation Is ...
A Study Is Being Conducted on Air Quality at a ...
Data Are Collected from 1100 Randomly Selected Students Who Graduated ...
Which of the Following Statements Is True of Pie Charts ...