Asked by Daniela Lopez on May 09, 2024

Verified
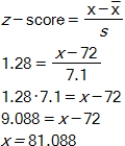
Stephen is starting a wine cellar but only wants to stock bottles in the top 10% of Wine magazine's ratings of 500 wines.The average rating given by the magazine was 72 with a standard deviation of 7.1.Use the standard distribution table to help Stephen discover what wine rating is necessary for a wine to be in the top 10%. 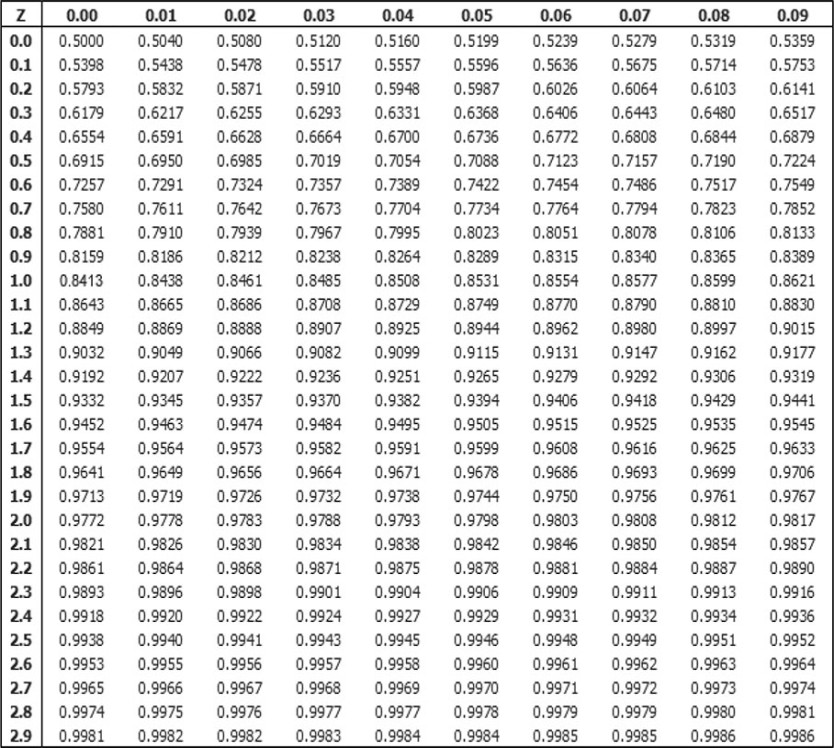
Standard Distribution Table
A tool used in statistics that shows the probabilities associated with a standard normal distribution.
Wine Magazine's Ratings
Evaluations or classifications provided by wine publications that assess the quality, taste, and value of wines.
- Determine and explain the significance of correlation coefficients.
- Assess and figure out measures of variability.

Verified Answer
DA
Danisha AllenMay 15, 2024
Final Answer :
If Stephen only wants to look at the top 10%,he wants a score in the 90th percentile,which means that 90% of the wines will fall below that mark.The probability closest to 0.90 in the standard normal table is associated with a z-score of 1.28.The data value associated with a z-score of 1.28 is 81.088.Stephen should focus on wines with a rating above 81.

Learning Objectives
- Determine and explain the significance of correlation coefficients.
- Assess and figure out measures of variability.