Asked by solin talamantes on May 26, 2024

Verified
Six points have these coordinates: 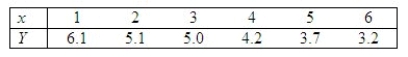 The normal probability plot and the residuals versus fitted values plots generated by Minitab are shown below.
 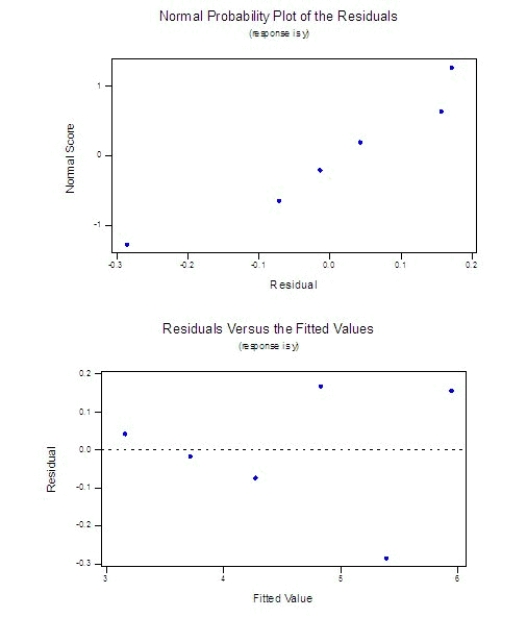 Does it appear that any regression assumptions have been violated?
______________
Explain.
________________________________________________________
Regression Assumptions
Fundamental conditions that must be met for the results of a regression analysis to be valid, including linearity, independence of errors, homoscedasticity, and normality of residuals.
Normal Probability Plot
A graphical technique for assessing whether or not a data set is approximately normally distributed, plotting observed values against normally distributed scores.
Residuals Versus Fitted Values
A method to visualize the difference between observed values and those predicted by a model, useful in diagnosing model fit.
- Familiarize oneself with the basic premises upon which simple linear regression analysis is built, including the assumptions of a normal distribution, constant variability, and the autonomy of data points.
- Develop the skill to assess the assumptions of regression through the analysis of residual plots.

Verified Answer

Learning Objectives
- Familiarize oneself with the basic premises upon which simple linear regression analysis is built, including the assumptions of a normal distribution, constant variability, and the autonomy of data points.
- Develop the skill to assess the assumptions of regression through the analysis of residual plots.
Related questions
The Primary Tool for Determining Whether the Assumptions Made About ...
The Difference Between the Observed Value of the Dependent Variable ...
The 'Assumption of Normality' Refers to ______ ...
Suppose That the Sample Regression Equation of a Model Is ...
In ANOVA, a Factor Is an Independent Variable Whose Values ...