Asked by Kayla Valdes on Jul 11, 2024

Verified
Simple random samples of 350 women and 450 men from Michigan are obtained.The 800 people in the sample are categorized according to where they went to school: in state,out of state,or no college.  The SPSS output for the above table is given below.The output includes the cell counts and the most expected cell counts.Expected counts are printed below observed counts.
 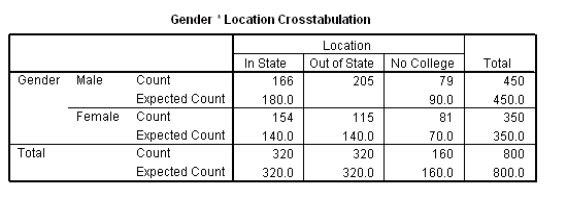 The chi-square statistic for these data equals 13.5.What do we know about the P-value for testing that there is no association between college location and gender?
A) P-value < 0.001
B) 0.001 < P-value < 0.0025
C) 0.0025 < P-value < 0.005
D) P-value > 0.005
Chi-square Statistic
A number that tells us how much the observed counts in a statistical test differ from the counts we would expect if there were no relationship in the population.
P-value
The probability of obtaining test results at least as extreme as the results actually observed, under the assumption that the null hypothesis is correct.
Null Hypothesis
A statement in statistical analysis that implies no effect or no difference, and serves as the starting assumption for testing.
- Develop proficiency in the conceptual and applied aspects of chi-square tests, including expected counts and discerning the independence of variables.
- Develop an understanding of statistical significance and how P-values are used to make inferences about populations.

Verified Answer

Learning Objectives
- Develop proficiency in the conceptual and applied aspects of chi-square tests, including expected counts and discerning the independence of variables.
- Develop an understanding of statistical significance and how P-values are used to make inferences about populations.
Related questions
A Researcher Performed a Study to Determine Whether Political Party ...
Use the Sample Data Below to Test Whether Car Colour ...
A Researcher Performed a Study to Determine Whether an Association ...
160 Students Who Were Majoring in Either Math or English \[\begin{array} ...
In the Chi-Square Goodness-Of-Fit Test, If the Expected Frequencies ...