Asked by ARIELA FERMIN GARCIA on May 25, 2024

Verified
Shown below are the boxplot,the histogram and summary statistics for the weekly salaries (in dollars) of 24 randomly selected employees of a company: 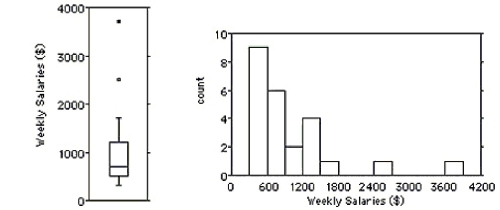 Count Mean Median StdDev Min Max Q1 Q3 24978.8705765.731037005101225\begin{array} { c | c | c | c | c | c | c | c } \text { Count } & \text { Mean } & \text { Median } & \text { StdDev } & \text { Min } & \text { Max } & \text { Q1 } & \text { Q3 } \\\hline 24 & 978.8 & 705 & 765.7 & 310 & 3700 & 510 & 1225\end{array} Count 24 Mean 978.8 Median 705 StdDev 765.7 Min 310 Max 3700 Q1 510 Q3 1225 Write a few sentences describing the distribution.
A) The distribution is unimodal and skewed to the right.As shown in the boxplot,there are two outliers,weekly salaries of $2500 and about $3700.The median was 978.8,while the mean was 705,above the median score.The middle 50% of the weekly salaries were between $510 and $1225 for an IQR of $715.
B) The distribution is bimodal and skewed to the right.As shown in the boxplot,there are two outliers,weekly salaries of $2500 and about $3700.The median was 705,while the mean was 978.8,above the median score.The middle 50% of the weekly salaries were between $705 and $1225 for an IQR of $520.
C) The distribution is unimodal and skewed to the left.As shown in the boxplot,there are two outliers,weekly salaries of $2500 and about $3700.The median was 705,while the mean was 978.8,above the median score.The middle 50% of the weekly salaries were between $705 and $1225 for an IQR of $520.
D) The distribution is unimodal and skewed to the right.As shown in the boxplot,there are two outliers,weekly salaries of $2500 and about $3700.The median was 705,while the mean was 978.8,above the median score.The middle 50% of the weekly salaries were between $510 and $1225 for an IQR of $715.
E) The distribution is unimodal and skewed to the left.As shown in the boxplot,there are two outliers,weekly salaries of $2500 and about $3700.The median was 705,while the mean was 978.8,above the median score.The middle 50% of the weekly salaries were between $510 and $1225 for an IQR of $715.
Unimodal
Describing a distribution with a single prominent peak or mode, indicating the most commonly occurring value.
Median
The middle value in a sorted list of numbers, which separates the higher half from the lower half of the dataset.
Mean
A statistic that represents the average value in a set of numbers, calculated by adding all values and dividing by the number of values.
- Discover and describe the structure of data distributions, like symmetric, leaning left, and leaning right.
- Recognize and interpret box plots and their significance in data analysis.
- Evaluate and compare distributions among different samples or groups.

Verified Answer

Learning Objectives
- Discover and describe the structure of data distributions, like symmetric, leaning left, and leaning right.
- Recognize and interpret box plots and their significance in data analysis.
- Evaluate and compare distributions among different samples or groups.
Related questions
Here Are Some Summary Statistics for Annual Snowfall in a ...
Here Are Summary Statistics for the Time,in Minutes,it Took for ...
Here Are Some Summary Statistics for Last Year's Basketball Team \(\text ...
The Free Throw Percentages for the Participants in a Basketball ...
Here Are Some Summary Statistics for All of the Runners \(\text ...